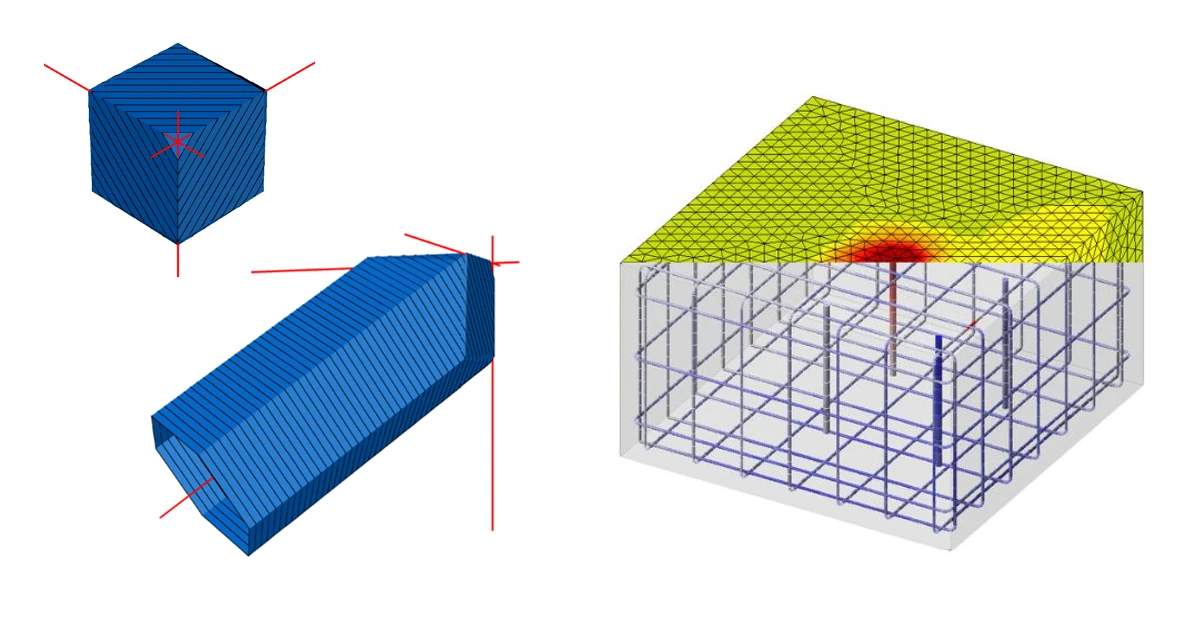


1 Introduction to the 3D CSFM method
1.1 General introduction for the structural design of concrete 3D details
1.2 Main assumptions and limitations
1.3 Mohr-Coulomb plasticity theory implementation in 3D CSFM
1.4 General mechanics assumptions for 3D CSFM
2 Analysis model of IDEA StatiCa 3D Detail
2.1 Introduction to finite element implementation
2.2 General finite element types
2.3 Load transfer devices
2.4 Meshing in 3D CSFM
2.5 Solution method and load-control algorithm for 3D CSFM
2.6 Presentation of 3D results
2.7 Model imported from IDEA StatiCa Connection
3 Model verification
4 Structural verifications according to EUROCODE
4.1 Material models in 3D CSFM (EN)
4.2 Partial safety factors
4.3 Ultimate limit state checks
5 Structural verifications according to ACI 318-19
5.1 Material models in 3D CSFM (ACI)
5.2 Strength reduction and load factors
5.3 Strength verifications
6 Structural verifications according to AASHTO
6.1 Material models in 3D CSFM (AASHTO)
6.2 Resistance and load factors
6.3 Strength limit state verifications
7 Structural verifications according to AS 3600
7.1 Material models in 3D CSFM (AUS)
7.2 Stress and strength reduction factors and load factors
7.3 Strength and anchorage verifications
8 Structural verifications according to CSA A23.3:24
8.1 Material models in 3D CSFM (CSA)
8.2 Resistance factors and load factors
8.3 Ultimate-limit-state-in-Detail-3D
1 Introduction to the 3D CSFM method
1.1 General introduction to the structural design of concrete 3D details
In practice, engineers may encounter different types of finite elements (from simple 1D bar elements to more complicated 3D brick elements) that are used in a variety of applications for the analysis and design of structural elements. A common feature of most of the computations in practice tends to be the linear behavior of the models, the advantages of which are undoubtedly speed, clarity, and simply the fact that for a large variety of problems, this solution is quite sufficient.
Especially in the world of concrete structures, it often happens that the linear approach is not sufficient simply because after the first cracks appear in the loaded element, the stresses are redistributed and the problem becomes significantly non-linear.
For these cases, it is necessary to choose one of the more sophisticated approaches. For 1D cases, analytical methods defined directly in codes can often be found. For example, popular Strut and Tie models can be built for 2D planar elements and discontinuity regions (D-regions), or the more sophisticated stress field method implemented in IDEA StatiCa Detail, CSFM, can be used.
However, if the engineer encounters a problem that cannot be simplified into planar behavior, the options are very limited. Of course, a 3D Strut and Tie model can be built or semi-scientific software can be used for accurate analysis. These procedures are often time-consuming, not code-compliant, and require an engineer knowledgeable in advanced modeling methods.
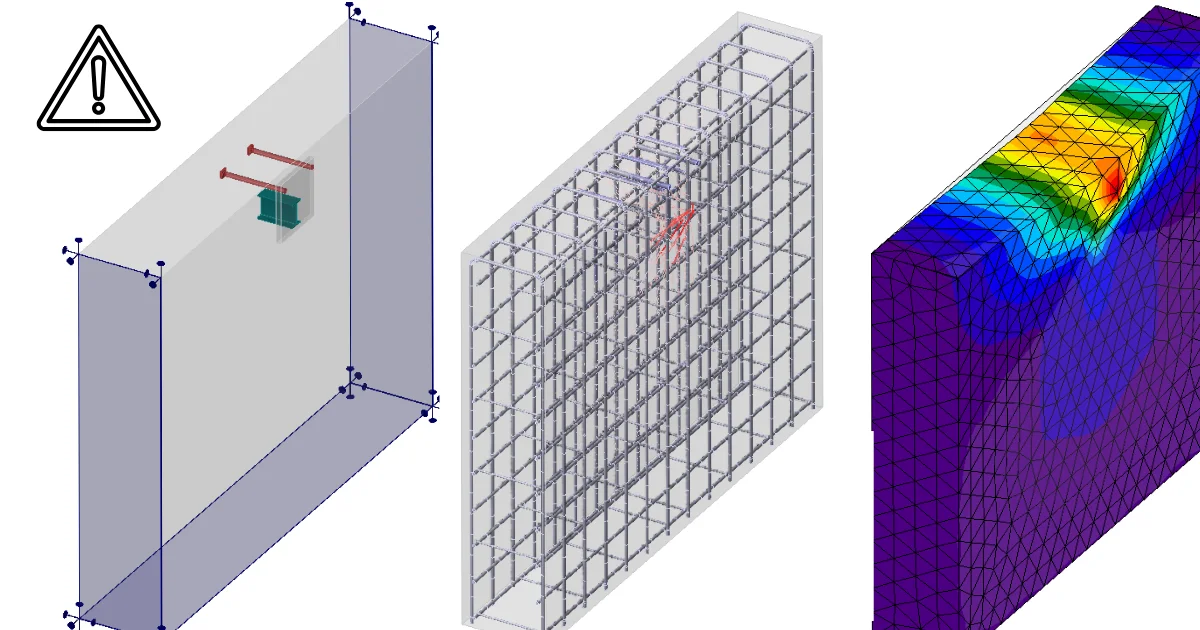
For this reason, IDEA StatiCa has developed and implemented the 3D CSFM (Compatible Stress Field Method) in the Detail application. 3D CSFM extends the established CSFM into a third dimension, offering a fast and code-compliant solution that is primarily applicable to the everyday engineer, giving them a unique new ability to safely tackle the complex details of concrete structures.
1.2 Main assumptions and limitations for CSFM in 3D
3D CSFM defines the concrete behavior based on the Modified Mohr-Coulomb plasticity theory for monotonic loading. The method considers principal concrete stresses in compression and reinforcement stresses (σsr) at the cracks while neglecting the concrete tensile strength (tension cut-off), except for its stiffening effect on the reinforcement (Tension stiffening).
σc1r, σc2r, σc3r ≤ 0 MPa
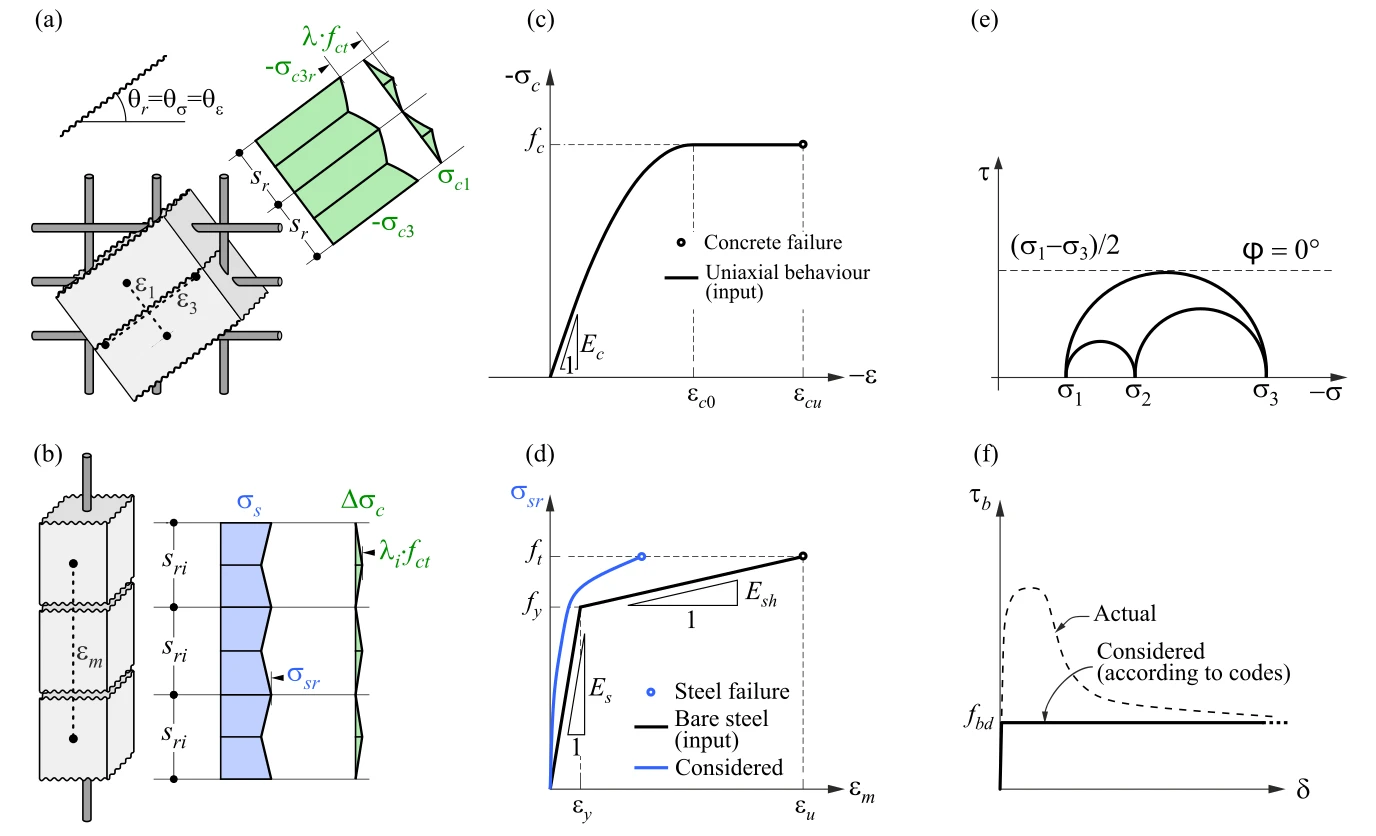
The reinforcement bars are linked to concrete volume finite elements through bond elements, allowing for slip between the concrete and reinforcement. It should be noted that 3D CSFM is not suitable for simulating plain concrete due to the absence of tension, which may result in misleading deformation and model divergence. Generally, the Mohr-Coulomb theory includes two fundamental properties governing the evolution of the plasticity surface in compression and partially in tension: the internal friction angle φ and cohesion parameter c. 3D CSFM assumes a zero angle of internal friction (Fig. 1.2.1e), leading to a conservative design due to the plasticity surface resembling the Tresca model, which is independent of the first stress invariant.
Concrete
The presented material model is a multisurface plasticity model given by the combination of the Mohr-Coulomb and Rankine models for monotonic loading. It’s important to note that this model does not address unloading, therefore, state variables are not stored, as they would be in classical plasticity models used for cyclic loading.
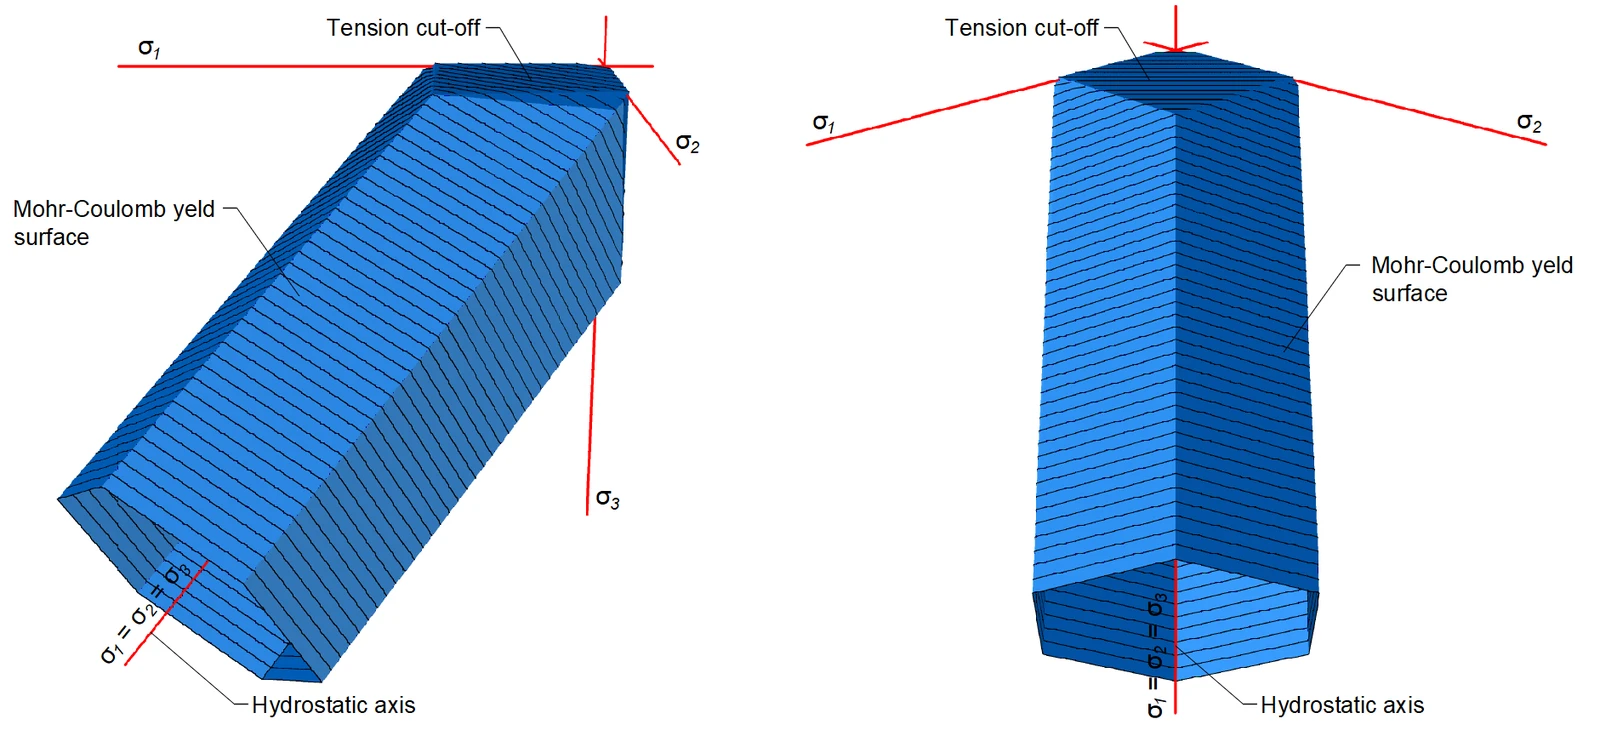
As already mentioned, the material model is intended for use in applications that calculate the response of reinforced concrete (not suitable for plain concrete). This is due to the exclusion of concrete in tension. Therefore, the model is not even suitable for structural elements where the design rules for reinforced concrete such as minimum reinforcement ratio, maximum bar spacing, etc., are not fulfilled. It should also be added that, for numerical stability reasons, a very small tensile capacity is defined in the model. The tensile part is restricted by planes corresponding to the Rankine model.
3D CSFM in IDEA StatiCa Detail does not consider an explicit failure criterion in terms of strains for concrete in compression (i.e., it considers an infinitely plastic branch after the peak stress is reached). This simplification does not allow the deformation capacity of structures failing in compression to be verified. However, their ultimate capacity is properly predicted when the increase in the brittleness of concrete as its strength rises is considered by means of the 𝜂𝑓𝑐 reduction factor defined in fib Model Code 2010 as follows:
where:
fc is the concrete cylinder characteristic strength (in MPa for the definition of ).
The fc,red is then compared with the Equivalent Principal Stress σc,eq in concrete, which will be defined further, of course, with consideration of all safety factors prescribed by code.
A detailed description of the concrete model can be found at the following link:
Reinforcement
The bilinear stress-strain diagram for reinforcement bars, as defined by design codes (Fig. 1.2.1d), represents an idealized model. This model necessitates knowledge of the basic properties of the reinforcement during the design phase, specifically the strength and ductility class. Alternatively, users have the option to define a customized stress-strain relationship.
Tension stiffening is considered by modifying the stress-strain relationship of the bare reinforcing bar to capture the average stiffness of the bars embedded in the concrete (εm) (Fig 1.2.1b).
Anchorage
Bond-slip between reinforcement and concrete is introduced in the finite element model by considering the simplified rigid-perfectly plastic constitutive relationship presented in (Fig. 1.2.1f), with fbd being the design value (factored value) of the ultimate bond stress specified by the design code for the specific bond conditions.
This is a simplified model with the sole purpose of verifying bond prescriptions according to design codes (i.e., anchorage of reinforcement). The reduction of the anchorage length when using hooks, loops, and similar bar shapes can be considered by defining a certain capacity at the end of the reinforcement, as will be described further.
Anchors
The element of the anchor is defined as being able to transfer normal tensile or compression forces, as well as shear forces, considering the bending stiffness.
The following types of anchors are available:
- Cast-in-place anchors
- Reinforcement
- Washer plate
- Headed stud
- Cast-in-place reinforcement
- Reinforcement
- Threaded rods
Cast-in-place - Reinforcement
Modeled as ribbed reinforcement embedded in concrete. Bond strength is calculated according to selected code rules in the same way as for standard reinforcement. At the anchor end, an Anchorage type can be defined, working identically to reinforcement - an anchorage spring is applied with the β-factor set according to the chosen code. Three geometric shapes are available: Straight, L-shape, U-shape.
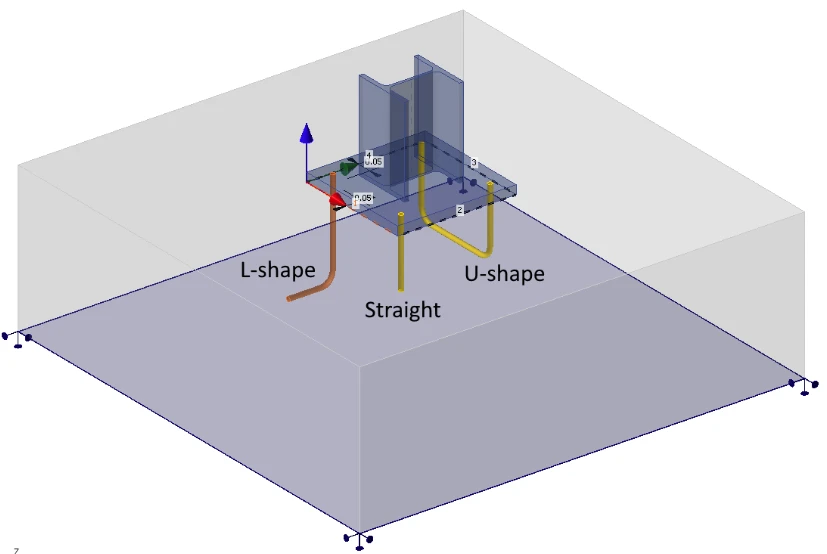
Cast-in-place - Washer plate and Headed stud
The washer plate and the head of the headed stud are modeled as a plate-shell element from the corresponding material attached directly to the anchor shank. It transfers load to the concrete through compression-only contact. Available shapes: circular and square (only circular for headed stud), with customizable dimensions. The washer plate and head model is elastic and is not checked for resistance.
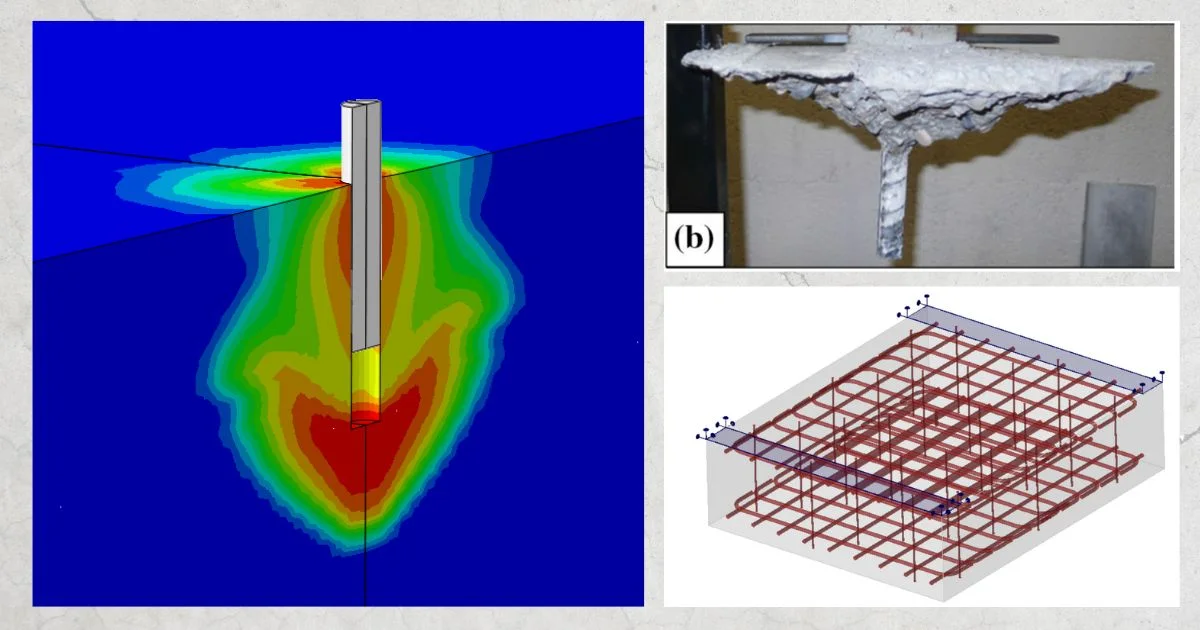
At the finite element model level, the pull-out of the anchor is directly checked. The compression contact has stop criteria set so that it is not able to transfer greater contact stress to the concrete than prescribed by the selected standard. In practical terms, this means that if the anchor were to be loaded with a force that does not comply with the pull-out assessment, the result would be premature termination of the calculation because this stop criterion would be exceeded during further loading.
The anchor shank has zero bond strength – all load is transferred to the concrete through the plate or head into the concrete.
Post-installed - Reinforcement and Threaded rod
Designed as bars installed into drilled holes and bonded with adhesive. The engineer specifies the design bond strength directly from the technical specification of the adhesive product.
Material model of anchors made of bolt material
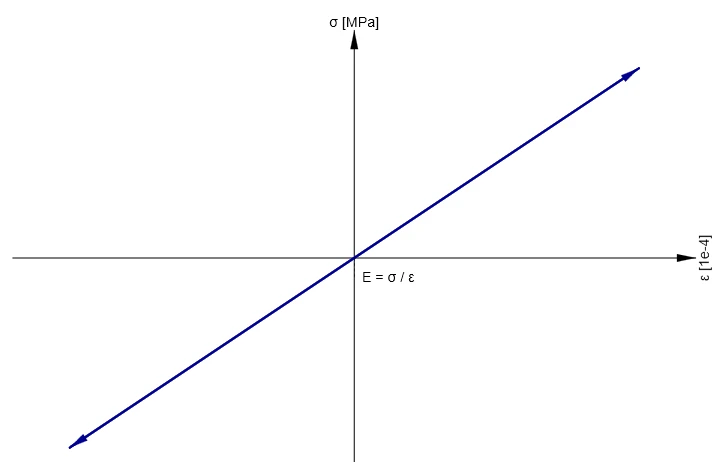
For anchors made of bolt material (threaded rods and anchors with washer plates), two properties of the material model differ from the nominal values of the bolt material: the modulus of elasticity and the ductility. Both describe the behaviour of the bolt assembly and the geometry of the test specimens on which the nominal values are measured. They do not depend on the design code, so they are applied identically for all design codes. Both the nominal stress-strain diagram of the bolt material and the diagram modified by the coefficients CE and CA are displayed in the Materials tab (Fig. 1.2.4).
Elastic stiffness. The modulus of elasticity of the bolt material is reduced by the coefficient CE:
- E - modulus of elasticity of bolt
- Eb - modulus of elasticity of the anchor used in the analysis
This approach was adopted on the basis of the latest research (not yet published; the reference will be added after publication), in which the effective modulus of elasticity of the bolt assembly was calibrated by finite element analysis against an extensive database of bolt tests. This is confirmed by already published experimental results of Janković et al. (2025): in 66 tensile tests of 1000 mm long threaded rods (M20 to M30, grades 8.8 and 10.9), the measured initial stiffness corresponded to 0.8·E·As/Lb, with a mean ratio of predicted to measured stiffness of 0.98 and a coefficient of variation of 7.9 %. In rods of this length, the influence of the nuts and the thread engagement is negligible, so the reduction represents an effective modulus of elasticity of the threaded rod itself. Incidentally, the same factor is contained in the stiffness of a bolt in tension in EN 1993-1-8 (coefficient 1.6 for a bolt row of two bolts).
Ductility. The ductility of bolt material is characterised by the percentage elongation after fracture A, typically around 10 %. These values are measured on short test pieces, where local necking forms a large part of the measured elongation. The length of the neck does not depend on the length of the specimen, so the percentage elongation decreases as the specimen gets longer. For anchors embedded several hundred millimetres into the concrete, it is substantially lower than the specified value. The application therefore uses the reduced ductility:
- A - percentage elongation after fracture of the bolt material
- Ared - reduced ductility, used as the strain stop criterion of the anchor
- CA - ductility reduction coefficient
- Ls - embedded length of the anchor [mm]
When the strain in the anchor reaches Ared, the stop criterion is met and the analysis is terminated, in the same way as the other stop criteria of 3D CSFM.
The equation was adopted on the basis of the latest research (not yet published; the reference will be added after publication), which provides an approximation of the plastic deformation of a bolt at its ultimate resistance, calibrated on an extensive database of bolt tests: Δu,p = A · (0.177 · L + 2.19), where L is the deforming length of the bolt in mm. The term proportional to the length represents the uniform elongation of the rod, and the constant term represents the local contribution of necking. In the application, the embedded length of the anchor Ls is taken as this length, and dividing Δu,p by Ls gives the strain A/CA. The coefficient CA increases with length and approaches the limit 1/0.177 = 5.65. For embedded lengths of 200 mm and more, it exceeds 5.3, so the ductility of the anchor is reduced to roughly one fifth of the nominal value, e.g. from 12 % to about 2.2 % at Ls = 300 mm.
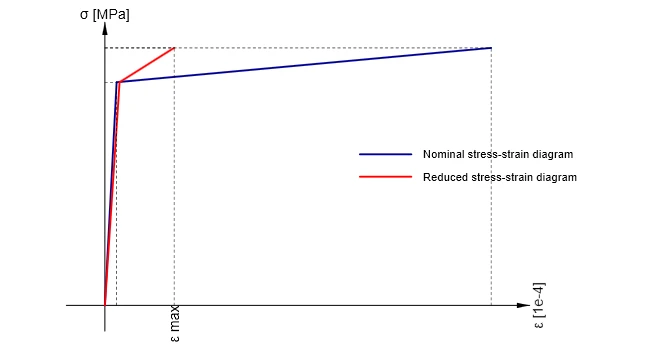
\[ \textsf{\textit{\footnotesize{Fig. 1.2.4\qquad Stress-strain diagram of the bolt material in the Materials tab: nominal diagram and the diagram modified by the coefficients CE and CA}}}\]
More information about connecting individual anchor types to the base plate or cast-in plate can be found in the chapter Finite elements types - Load transferring devices.
1.3 Mohr-Coulomb plasticity theory implementation in 3D CSFM
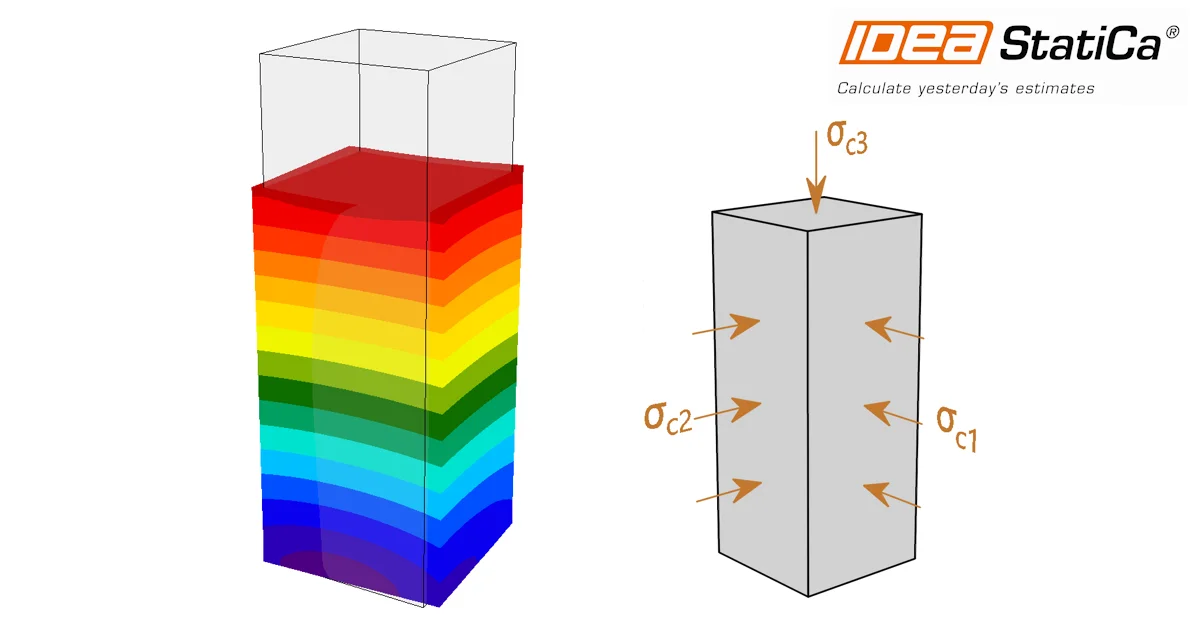
In the following chapter, we will take a look at how the Mohr-Coulomb theory is implemented in 3D CSFM. We will explain how the confinement effect (triaxial stress) is considered and how the Equivalent Principal Stress σc,eq is calculated, which is used to determine the load-bearing capacity from the point of view of concrete.
Introduction to the theory
Mohr–Coulomb theory is a mathematical model describing the response of brittle materials, to shear and normal stress. Most of the classical engineering materials follow this rule in at least a part of their shear failure envelope. Generally, the theory applies to materials for which the compressive strength far exceeds the tensile strength.
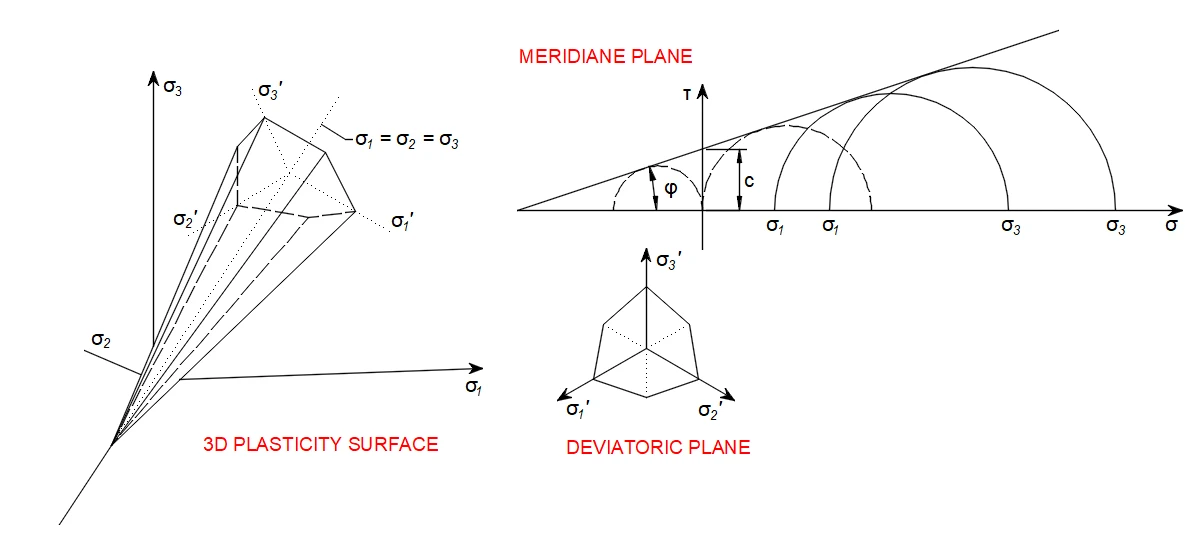
In structural engineering, it is used to determine failure load as well as the angle of fracture for displacement of fracture surface in concrete and similar materials. Coulomb's friction hypothesis is used to determine the combination of shear and normal stress that will cause a fracture of the material. Mohr's circle is used to determine which principal stresses will produce this combination of shear and normal stress and the angle of the plane in which this will occur. According to the principle of normality, the stress introduced at failure will be perpendicular to the line describing the fracture condition.
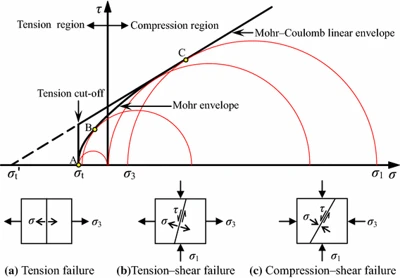
It can be shown that a material failing according to Coulomb's friction hypothesis will show the displacement introduced at failure forming an angle to the line of fracture equal to the angle of friction. This makes the strength of the material determinable by comparing the external mechanical work introduced by the displacement and the external load with the internal mechanical work introduced by the strain and stress at the line of failure. By conservation of energy, the sum of these must be zero and this will make it possible to calculate the failure load of the construction.
Implementation in 3D CSFM
In general, for a given angle of internal friction of the concrete, which is around φ = 30-40° in Reference [1], [2], [3], [4], the tensile and compressive strengths of the concrete Mohr's circles can be constructed as in Figure 1.3.3.
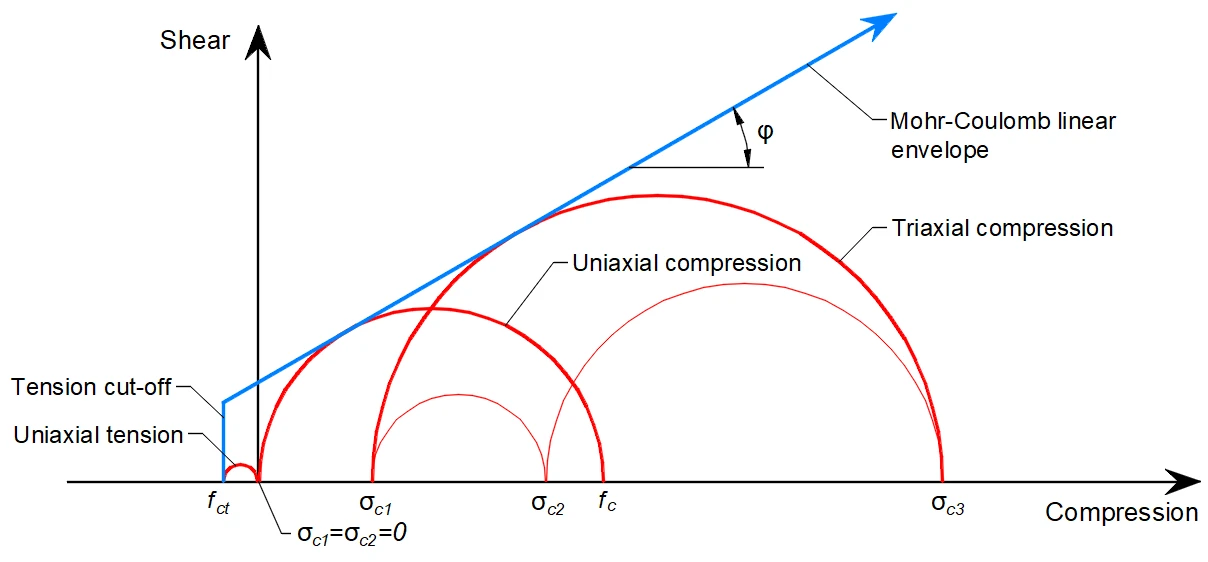
Where fc is concrete strength in compression, fct is concrete strength in tension, φ is the angle of internal friction, and σc1, σc3 are the principal stresses of concrete under triaxial compression.
It can be noticed that as the principal stress σc3 increases, the maximal possible difference between the values of σc3 and σc1, which we define as maximal σc,eq (see below), also increases. This difference corresponds to twice the deviatoric stress defined in the literature as a radius of the mohr circles.
In 3D CSFM implemented in IDEA StatiCa Detail, the angle of internal friction is considered as φ = 0°, as shown in Figure 7.
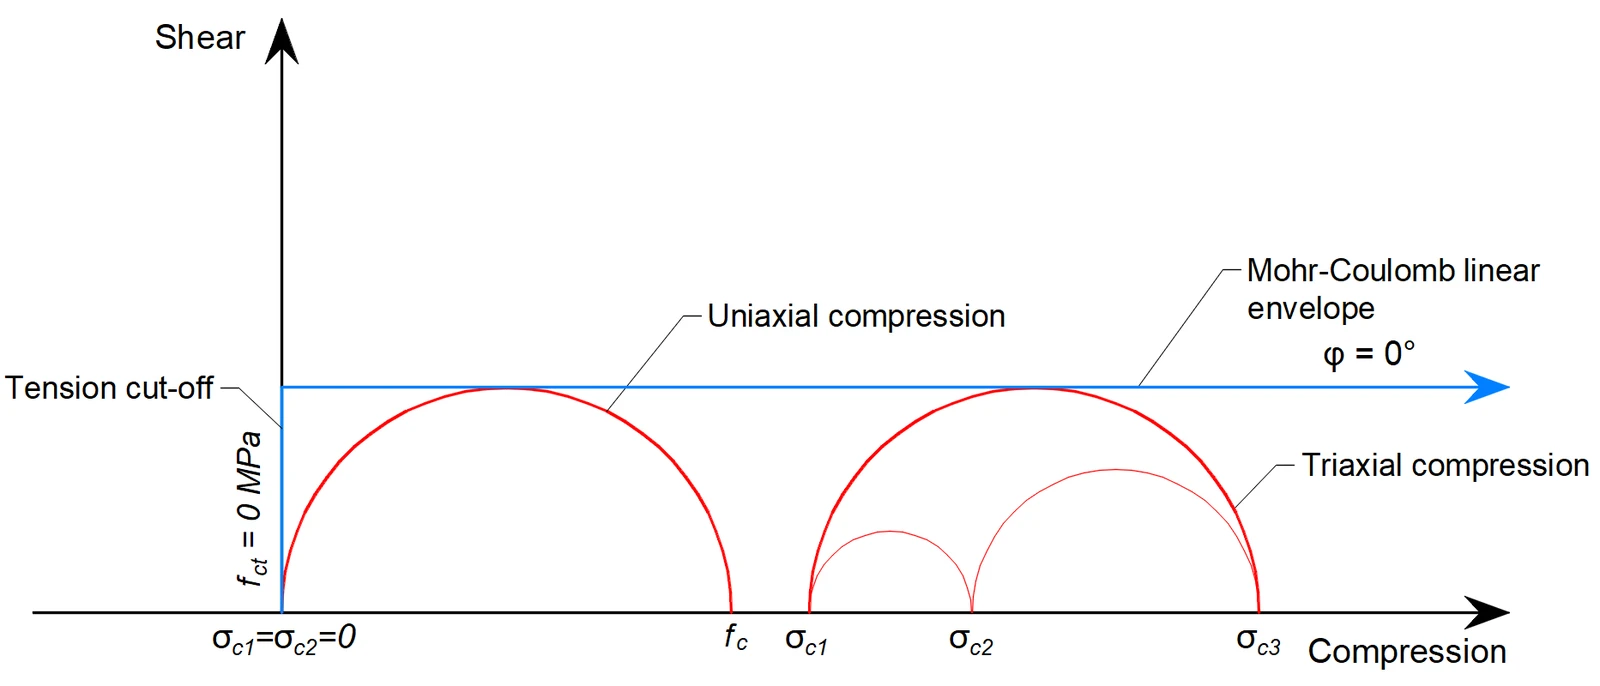
The practical consequence of this implementation is that the maximum difference between σc3 and σc1 is constant as σc3 increases.
Equivalent Principal Stress expresses the equivalent uni-axial stress for a general tri-axial stress state.
The σc,eq value can, therefore, be directly compared with uniaxial strength limits according to codes.
Where σc,lim is the design (factored) uniaxial strength of concrete fc.
Comparing Figure 1.3.3, where the real angle of internal friction is used, and Figure 1.3.4, which shows the Mohr-Coulomb theory implementation with zero angle of internal friction, it can be seen that the approach chosen for the calculations in Detail is very conservative for the assessment of triaxial stress state.
For a better understanding of the areas affected by tri-axial compression stress, the expression of the increase of the effective material strength due to tri-axial compression has been added to the IDEA StatiCa Detail application as a ratio σc3/σc,lim. You can find this ratio in the Strength code check.
In the Auxiliary results, the user can also find the κ factor, which explains the tri-axiality in a different way.
The concrete strength check can be then rewritten as:
It follows from the previous that if the element is under hydrostatic stress - σc3=σc2=σc1, the Equivalent Principal Stress σc,eq will have the zero value, and the kappa factor will reach infinity.
More can be found here: Tri-axial stress – the active confinement effect
1.4 General mechanics assumptions for 3D CSFM
Equilibrium equations
The theory of small deformations enables the assembly of the equilibrium equation based on the undeformed volume using a first-order approach.
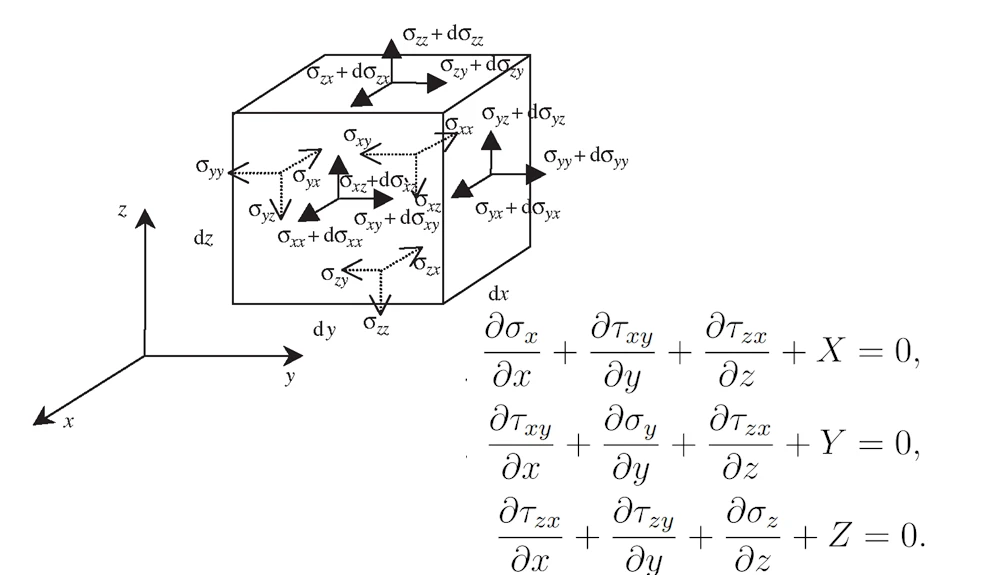
Compatibility equations
A solid body comprises infinitesimal volumes or material points, each of which is interconnected without gaps or overlaps. Mathematical conditions must be adhered to in order to prevent the occurrence of gaps or overlaps when a continuum body undergoes deformation.
Constitutive equations
The constitutive equations governing the behavior of 3D elements play a pivotal role in the analysis of material behavior in structural mechanics. These equations are formulated to accommodate the non-linear isotropic behavior, which is valid for solid block members in IDEA StatiCa Detail.
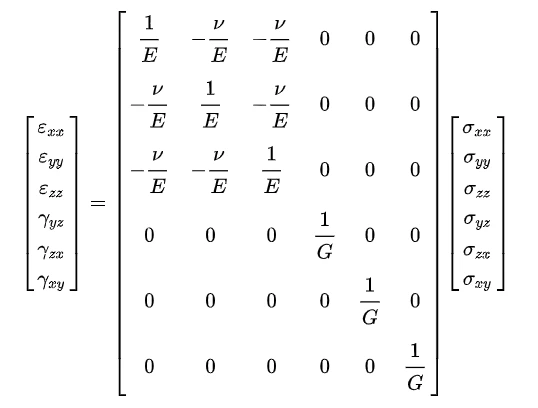
2 Analysis model of IDEA StatiCa 3D Detail
2.1 An introduction to finite element implementation
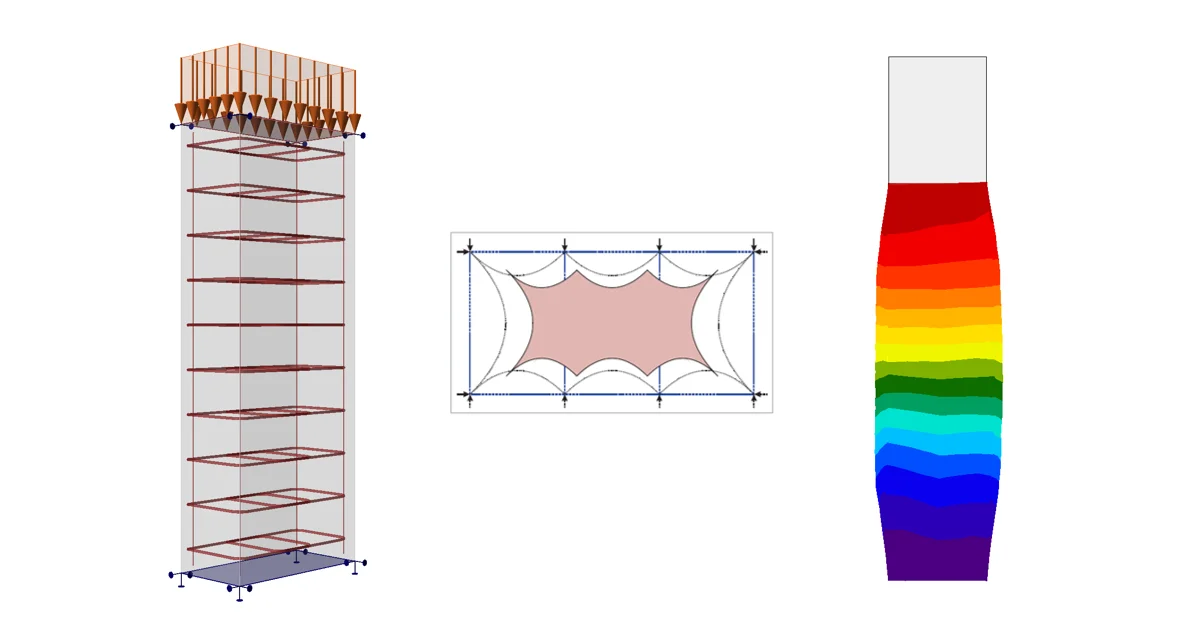
3D CSFM considers continuous stress fields in the concrete (3D finite elements), complemented by discrete “rod” elements representing the reinforcement (1D finite elements). Therefore, the reinforcement is not diffusely embedded into the concrete 3D finite elements but explicitly modeled and connected to them.
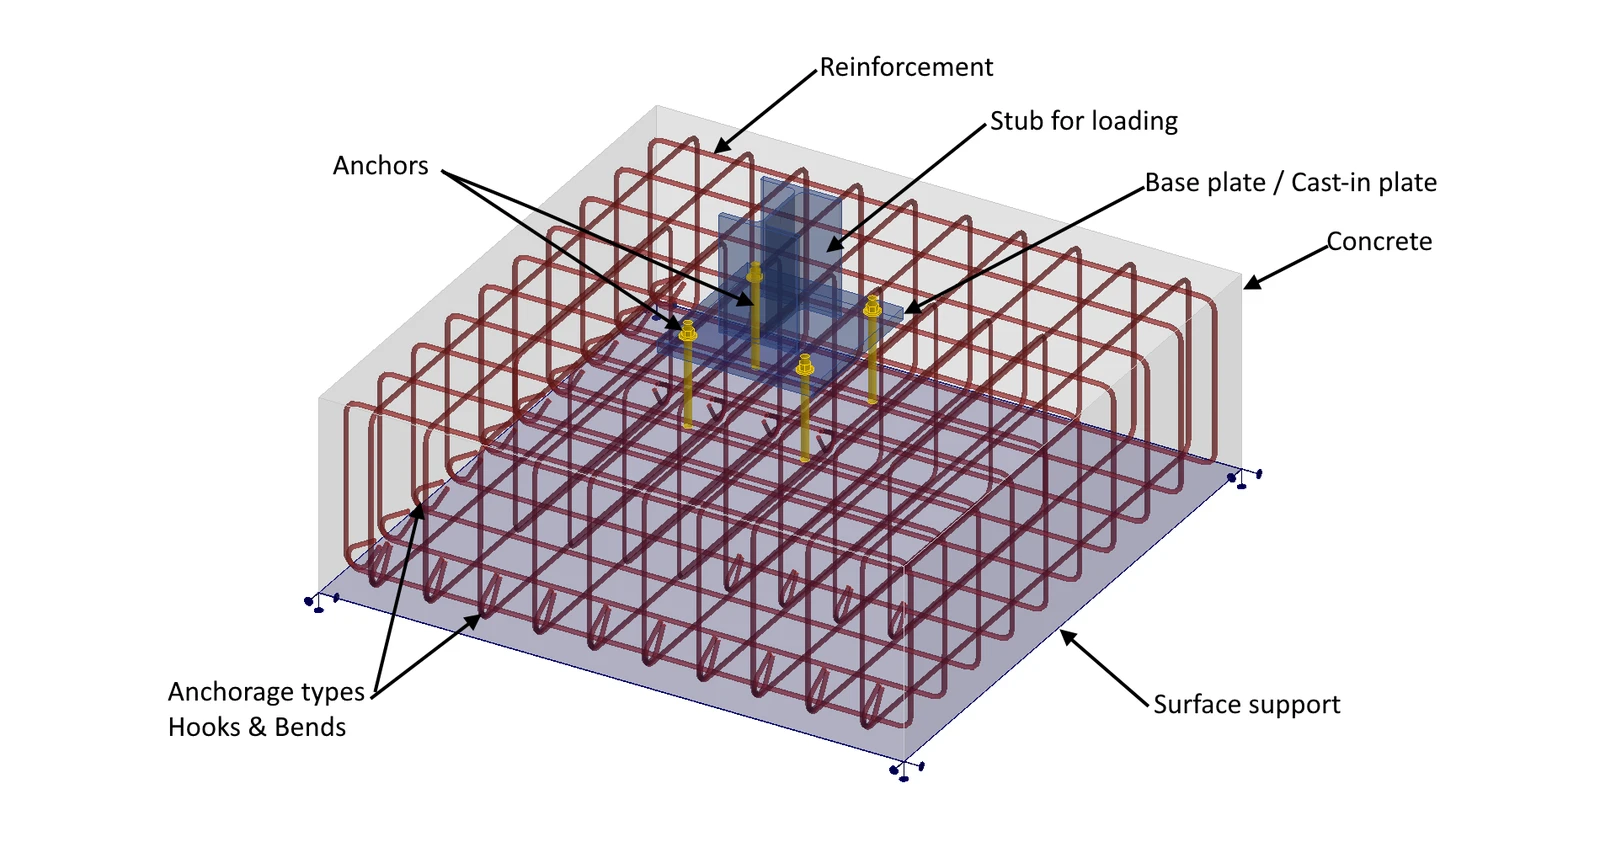
2.2 General finite element types
The non-linear (inelastic) finite element analysis model is created by several types of finite elements used to model concrete, reinforcement, and the bond between them. Concrete and reinforcement elements are first meshed independently and then interconnected using multi-point constraints (MPC elements). This allows the reinforcement to occupy any position not limited to nodes of tetrahedral mesh. To verify anchorage length, bond, and anchorage end spring elements are inserted between the reinforcement and the MPC elements.
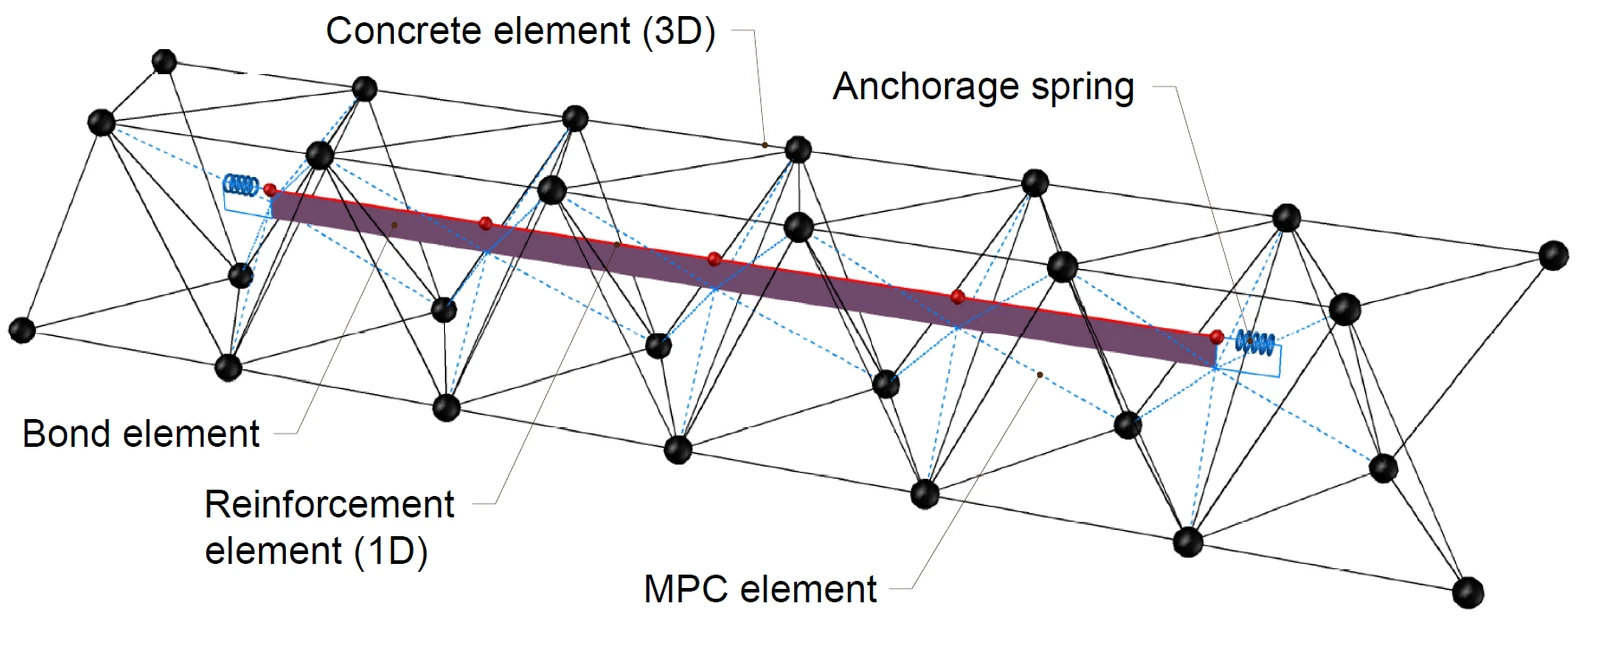
Concrete
Concrete is analyzed using mixed tetrahedral elements with nodal rotations. The tetrahedral elements allow us to mesh regions of any topology while the implemented formulation guarantees accurate deformation results (without spurious shear stress known as the shear lock effect) even for the coarse mesh which would not be suitable for linear tetrahedral elements formulation.
Full integration is utilized. It means that each element is equipped with four integration points situated within the volume. Such an integration yields a precise strain and stress field, allowing for sufficient evaluation and presentation of the results across the whole volume. Subsequently, the stop criteria are established based on the value in the integration point.
Reinforcement
Rebars are modeled by two-node 1D “rod” elements (CROD), which only have axial stiffness. These elements are connected to special “bond” elements that were developed in order to model the slip behavior between a reinforcing bar and the surrounding concrete. These bond elements are subsequently connected by MPC (multi-point constraint) elements to the mesh representing the concrete. This approach allows the independent meshing of reinforcement and concrete, while their interconnection is ensured later.
Bond elements
The anchorage length is verified by implementing the bond shear stresses between concrete elements (3D) and reinforcing bar elements (1D) in the finite element model. For this purpose, the “bond” finite element type was developed.
The bond element is defined as a shell finite element connected to elements representing reinforcement by the first layer and by the second layer to concrete mesh via multi-point constraints (MPC elements). It should be noted that the bond element is always displayed in this article with a non-zero height, which is, however, defined as infinitesimal in the model.
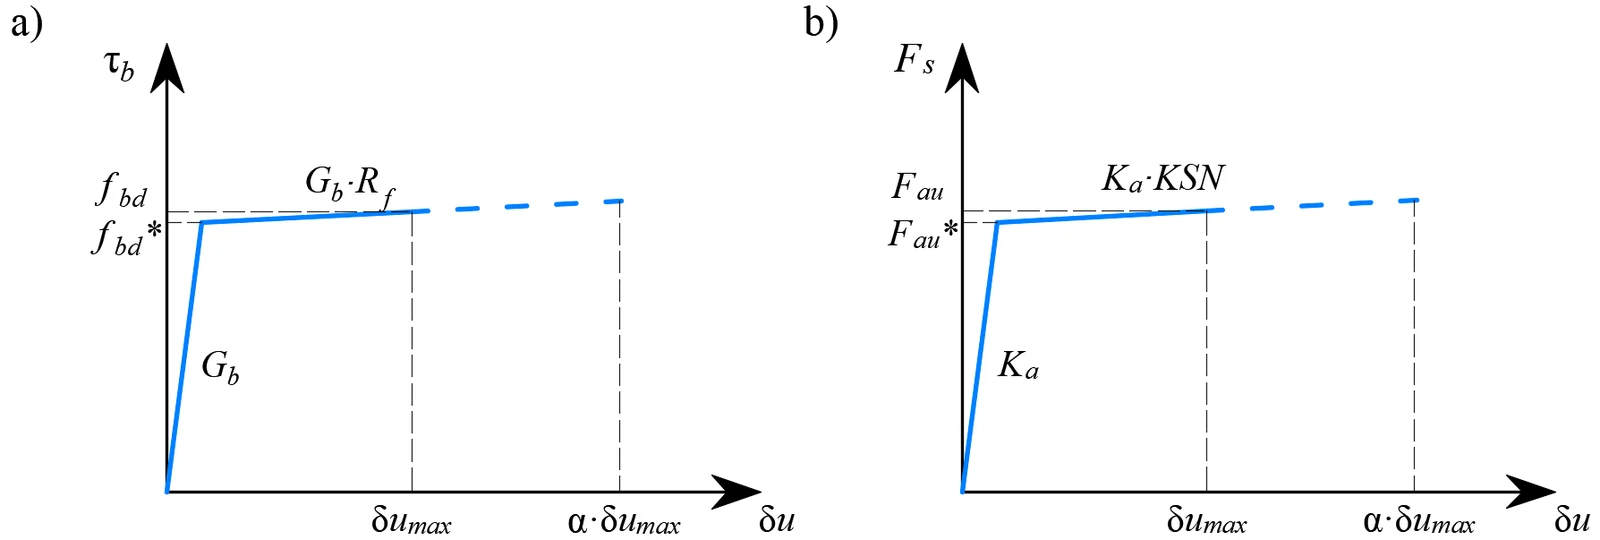
The behavior of this element is described by the bond stress, τb, as a bilinear function of the slip between the upper and lower nodes, δu, see (Fig. 2.2.2).
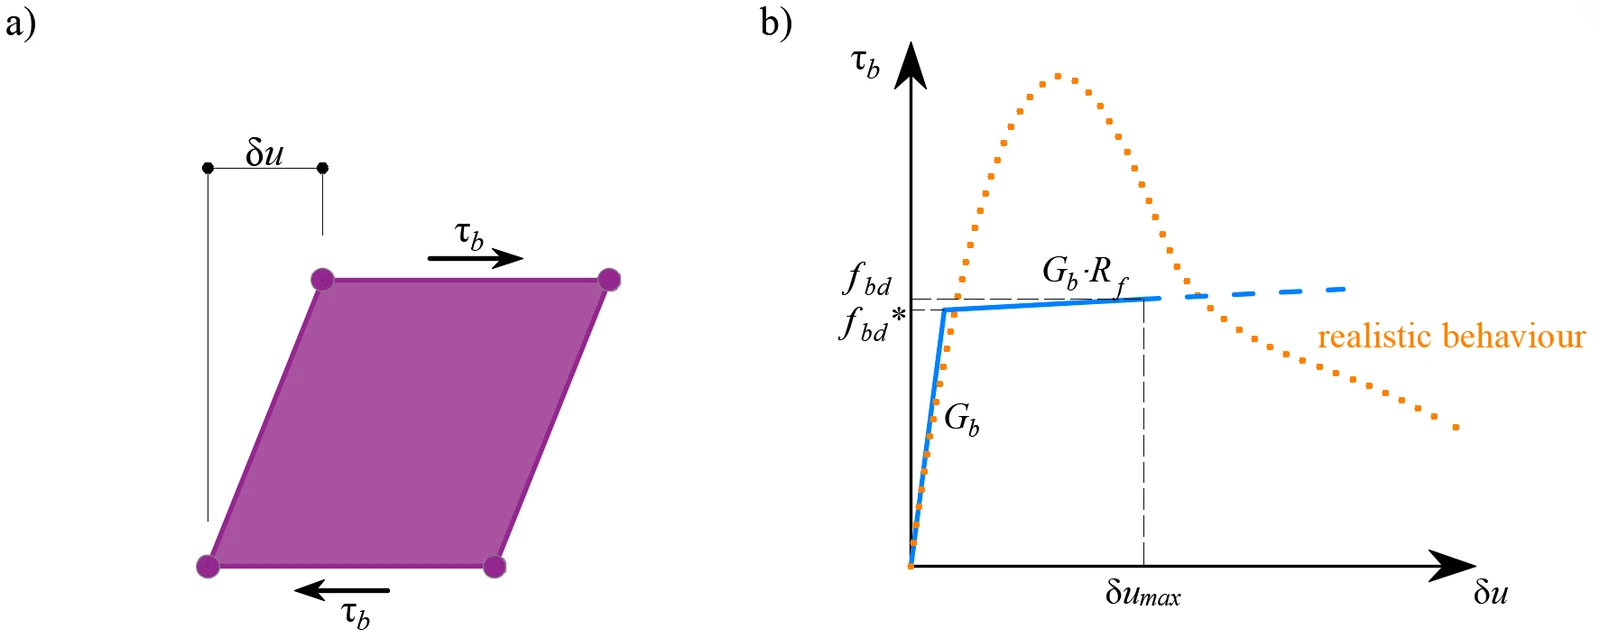
The elastic stiffness modulus of the bond-slip relationship, Gb, is defined as follows:
kg coefficient depending on the reinforcing bar surface (by default kg = 0.2)
Ec modulus of elasticity of concrete (taken as Ecm in case of EN)
Ø the diameter of the reinforcing bar
The design values (factored values) of ultimate bond shear stress, fbd, provided in the respective selected design codes EN 1992-1-1 or ACI 318-19 are used to verify the anchorage length. The hardening of the plastic branch is calculated by default as Gb/105.
Anchorage spring
The provision of anchorage ends to the reinforcing bars (i.e., bends, hooks, loops…), which fulfills the prescriptions of design codes, allows the reduction of the basic anchorage length of the bars (lb,net) by a certain factor β (referred to as the ‘anchorage coefficient’ below). The design value of the anchorage length (lb) is then calculated as follows:
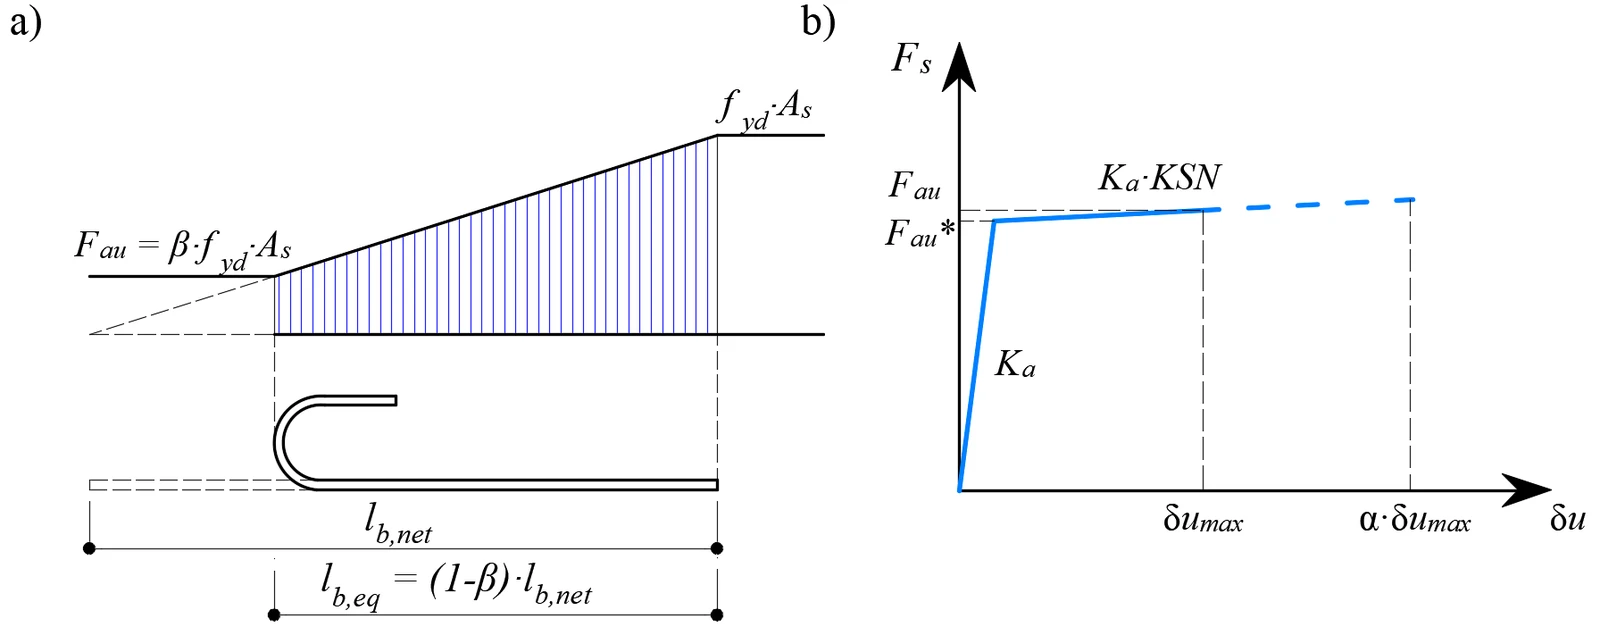
The reduction of the anchorage length is included in the finite element model by means of a spring element at the end of the bar (Fig. 2.2.3a), which is defined by the constitutive model shown in (Fig. 2.2.3b). The maximum force transmitted by this spring (Fau) is:
where :
β the anchorage coefficient based on anchorage type
As the cross-section of the reinforcing bar
fyd the design value (factored value) of the yield strength of the reinforcement
2.3 Load transfer devices
Base plate
The base plate is modeled as an elastic shell element. The steel material used for base plates is defined in the Materials tab. The only physical property is the modulus of elasticity E.
The base plate can be loaded by the point load (Fx, Fy, Fz, Mx, My, Mz) and the group of forces (Fx, Fy, Fz), mainly used for loading models exported from the IDEA StatiCa Connection. Note that point loads and point moments directly load the corresponding node of the base plate. It means that there is no redistribution, only by the stiffness of the base plate.
This implementation allows importing load effects from the IDEA StatiCa Connection that are applied to the base plate at the location of the individual weld finite elements with the value and direction determined from the general stress of that weld finite element. More can be read in the corresponding chapter of this document.
The second loading option is the Stub — representing a short portion of the column above the base plate. The stub is modeled as an elastic shell element structure and behaves as a physically accurate interface between the internal forces and the plate. The user selects a cross-section for the stub from a standard section database. The 6-component internal force set (forces and moments) is applied at a single point on the bottom face of the stub — i.e. the base of the column. Constraints transfer the forces to the top face of the stub, from where they are naturally redistributed through the stub into the base plate, anchors, and concrete.
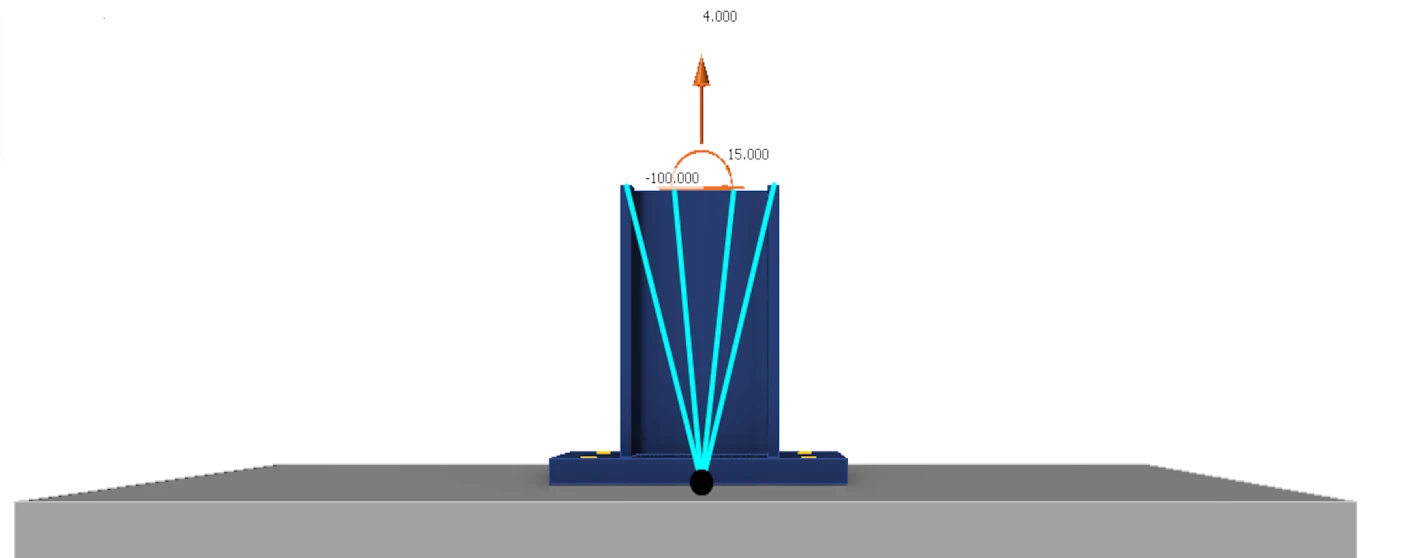
Shear transfer mechanism (from base plate to concrete block)
Frictional compression-only contact is defined between the baseplate and concrete. For the shear transfer user can choose from three options:
- By anchors
- By friction
- By shear lug
The software does not allow the combination of these shear transfer mechanisms.
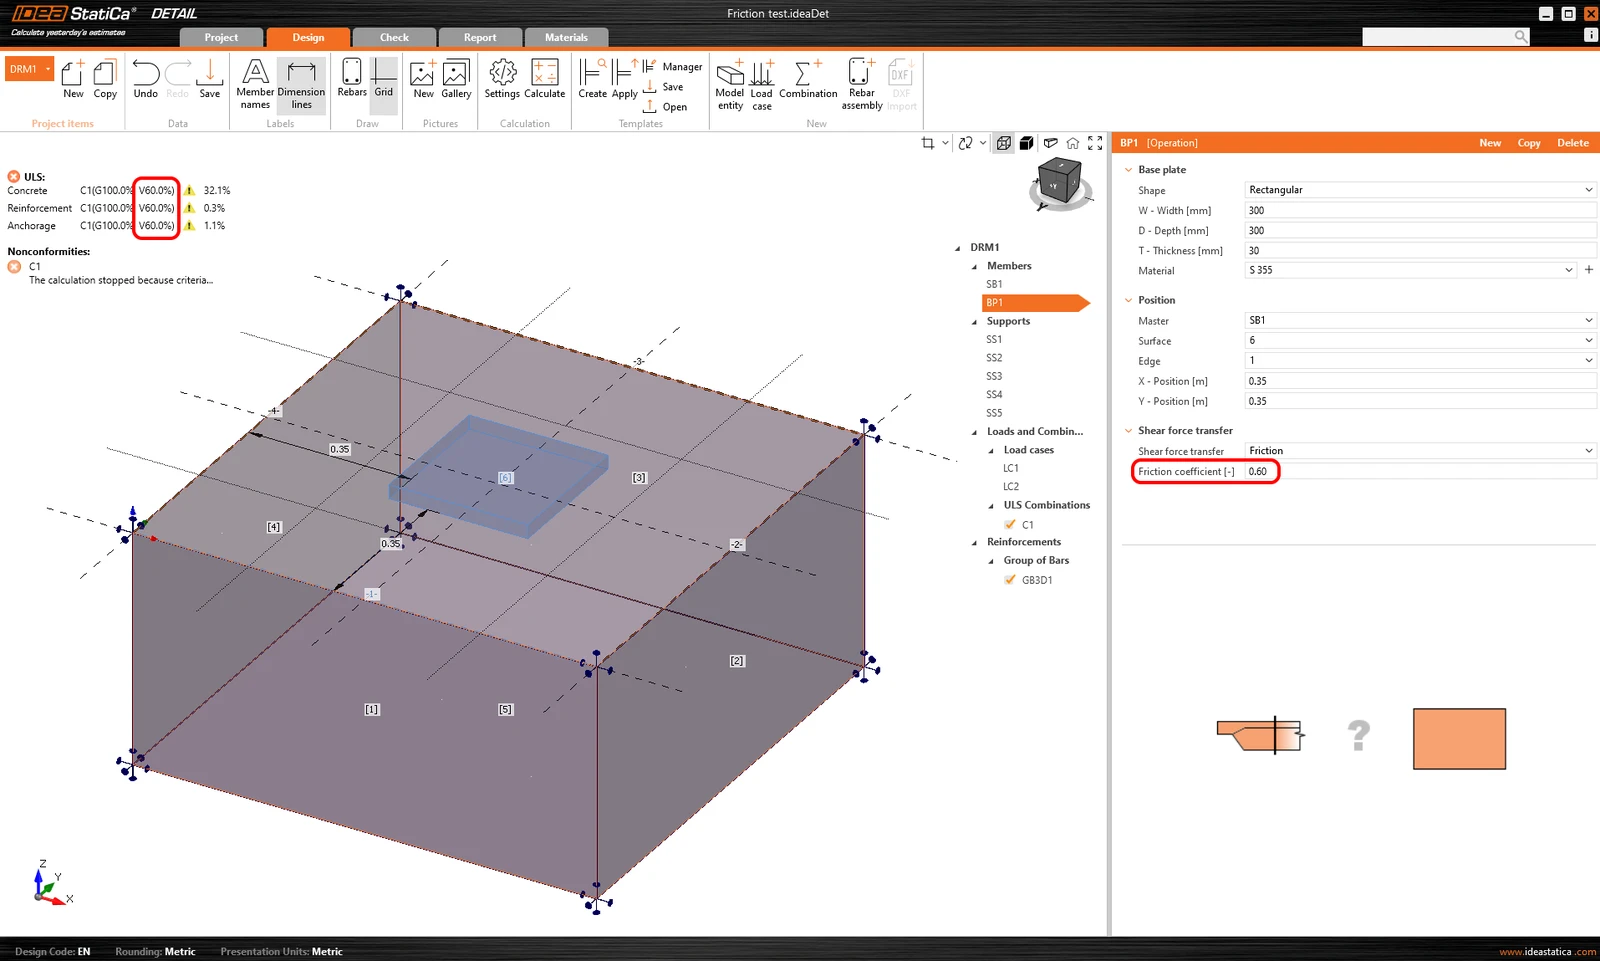
The friction coefficient should be input as a designed (factored) value. In case the resultant shear force Fxy exceeds the pressure force Fz times the frictional coefficient μ, the calculation will stop, and not all the loads will apply to the model. The condition is written as follows:
This can be seen in the following example, where two load cases are considered.
- LC1 - Permanent type - Fz = 100 kN
- LC2 - Variable type- Fx = 100 kN
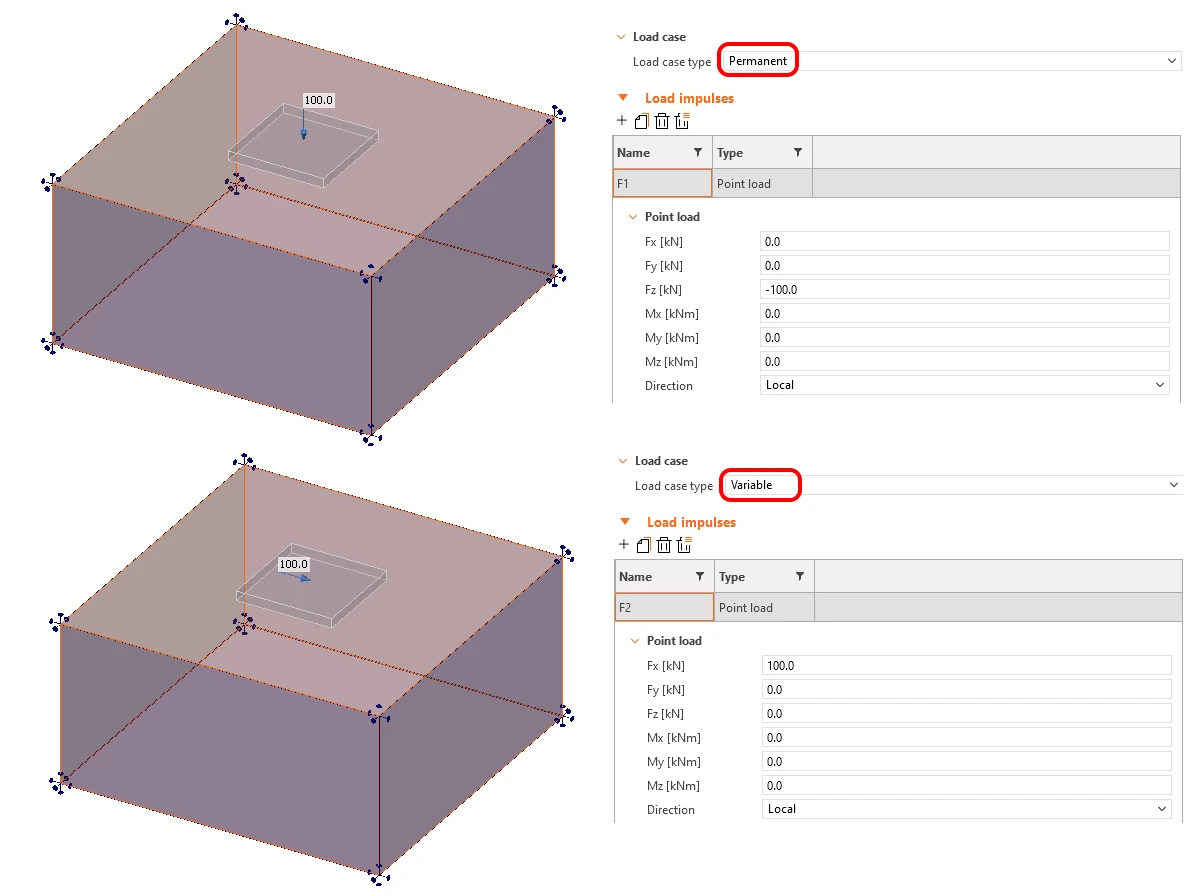
In the first calculation step, all the permanent load is applied. Then the variable load is gradually applied until it reaches the value of the pressure load times the friction coefficient.
The graph in Figure 2.3.5 defines the behavior of the frictional contact between the baseplate and concrete.
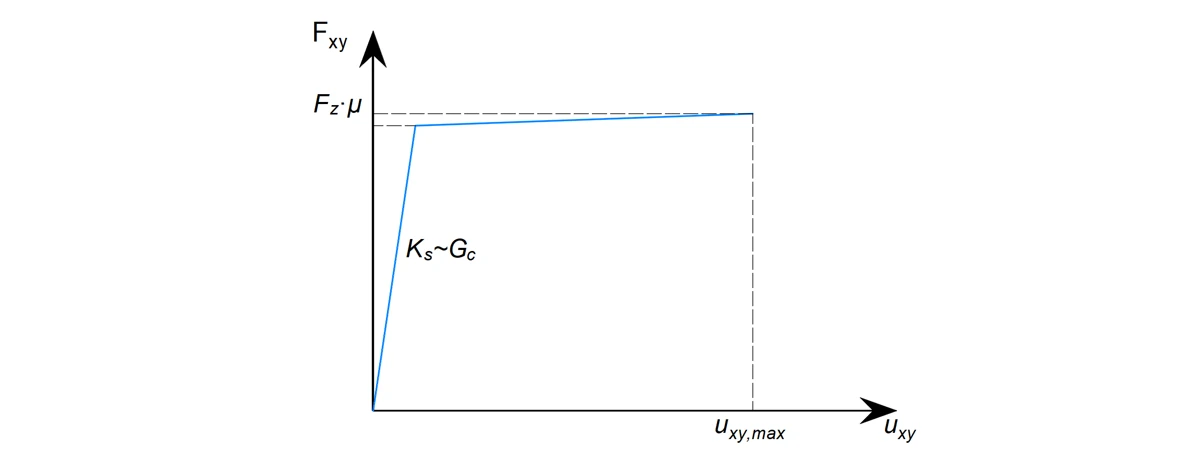
The value of Fzμ differs for each increment of the calculation, whereas the value of maximal shear deformation uxy is constant.
If the compressive normal force Fz and the shear force Fxy are input in one load case type (e.g. only permanent), and the condition of Fxy / (Fzμ) ≤ 1 is not fulfilled, no load will be applied to the model because the condition is not fulfilled in any increment of the calculation.
The shear lug is connected with the concrete mesh by constraints allowing only compression only normal stress transfer.
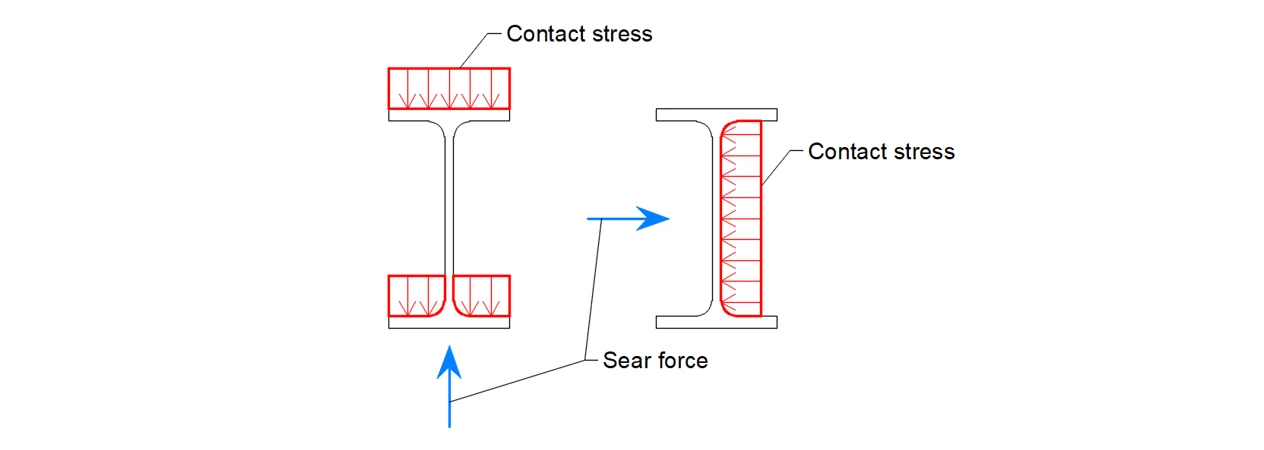
The shear lug is modeled from elastic shell elements, where the modulus of elasticity E defines the material.
The results are not evaluated and displayed for the base plate as well as for the shear lug.
Base plate options (stand-off, grout)
The following set of stand-off options, fully aligned with the Connection application, is available.
- Direct
- Mortar joint – nuts from the top
- Mortar joint – nuts from the top and bottom
- Gap
The mortar layer is modeled as a shell element, with its stiffness taken into account. Note that shell elements are incompressible in the direction of their thickness. This helps to redistribute local forces to the concrete and is valid for typical bedding thicknesses used in practice - 25-50 mm.
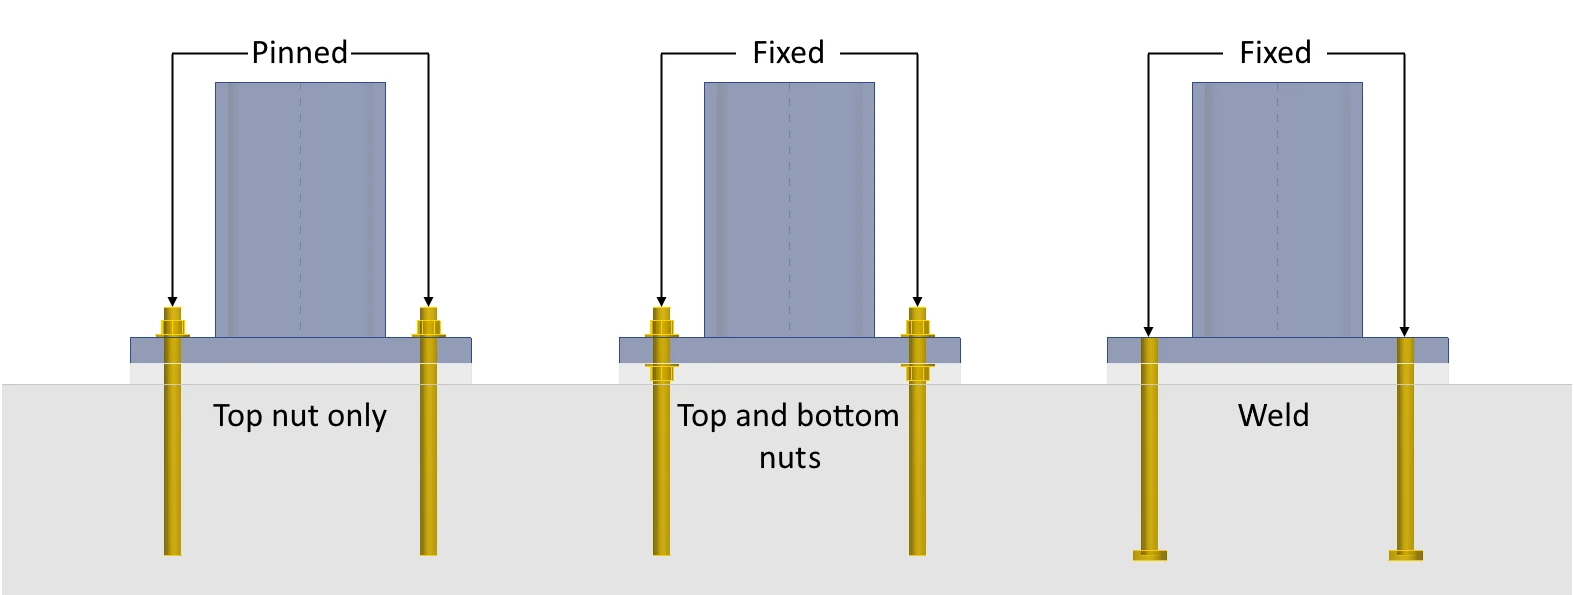
The distinction between nuts only from the top (pinned interconnection between anchor and base plate) vs. top and bottom (fixed interconnection between anchor and base plate) strongly influences the shear capacity from the point of view of concrete bearing.
Anchors
The finite elements representing anchors are modeled to be able to transfer normal and shear forces to the concrete, also taking into account the bending stiffness of the anchors. To model the slip between the anchor and the surrounding concrete, the same bond and MPC elements are used as for the reinforcement. With the difference that:
- For post-installed (adhesive) anchors, it is necessary to specify the design bond strength.
- For Washer plates and Headed studs, the bond is neglected along the shank of the anchor. All axial load is then transferred to the concrete through the washer plate or head of the anchor.
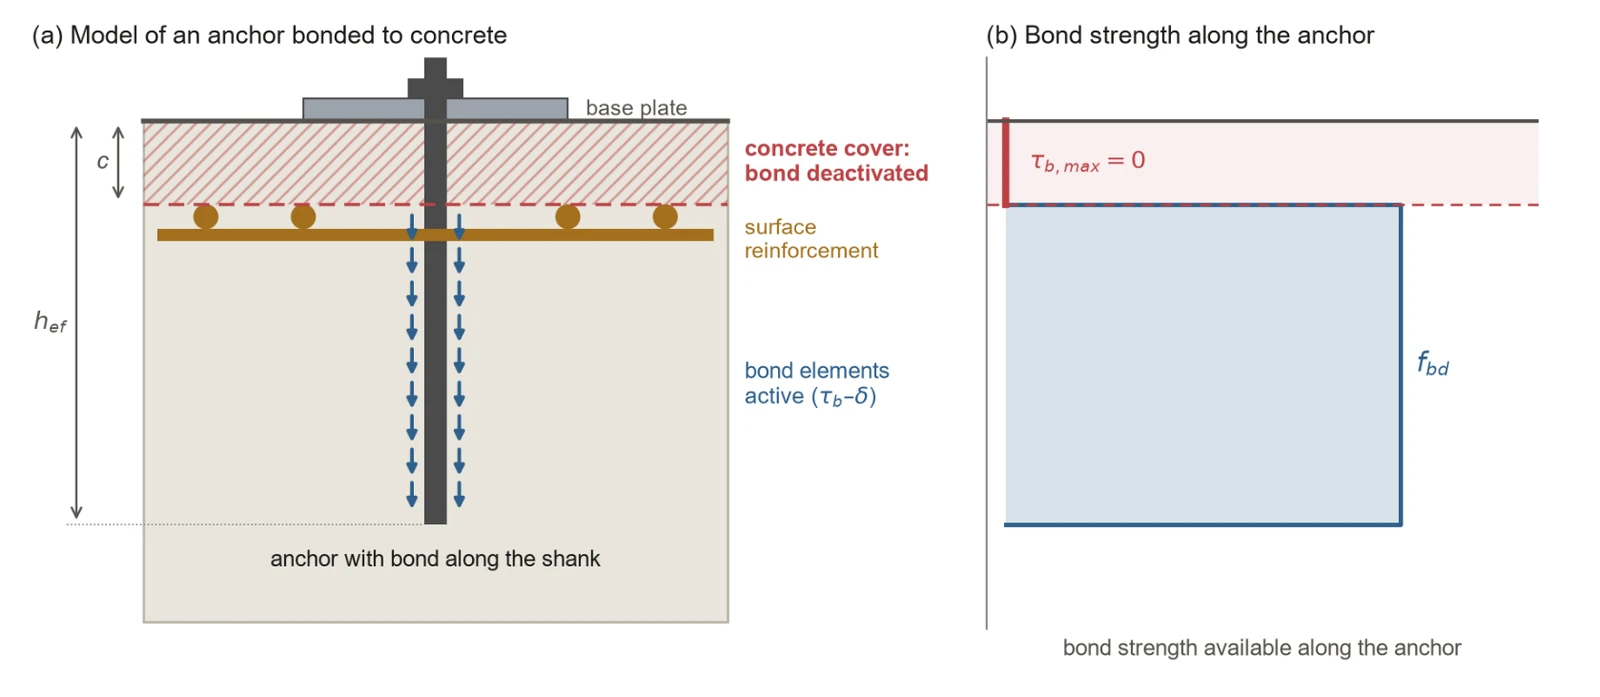
Bond within the concrete cover - For anchors connected to the concrete by bond along the shank, i.e. cast-in reinforcement anchors and post-installed (adhesive) anchors, the bond elements are not active within the concrete cover. The application determines the cover automatically as the distance from the concrete surface to the face of the surface reinforcement (Fig. 2.3.7a). Along this length, the bond strength between the anchor and the concrete is zero, and the anchor is connected to the concrete by bond elements only below the cover, over the remaining part of its embedment depth (Fig. 2.3.7b). All load transferred by bond is therefore introduced into the concrete enclosed by the surface reinforcement, and the bond stresses of the anchor within the cover are zero in the results.
The reason is the different failure behaviour of the concrete cover. 3D CSFM uses a plastic material model for concrete that allows stresses to redistribute (see Chapter 1.2). The concrete cover near a free surface, however, fails in a brittle manner governed by fracture mechanics, without any plastic reserve. If bond were active within the cover, the model would build up a compression field in a region that cannot reliably sustain it in reality, and it would overestimate the contribution of the cover to the anchor resistance. This error grows with the thickness of the cover. In addition, the cover is the part of the model exposed to the environment (carbonation, chlorides, aggressive agents), so its properties may degrade during the service life of the structure. Neglecting the bond within the cover is therefore a conservative assumption, consistent with the basic assumptions of 3D CSFM.
This assumption applies only to anchors that transfer the load to the concrete by bond along the shank. Headed studs and anchors with washer plates transfer the axial load through the head or plate, with zero bond along the shank, so they are not affected. Ordinary reinforcement is not affected either. The influence on the resistance is most pronounced for anchors whose resistance is governed by bond and which are installed in members with a large concrete cover, because a larger part of the embedment depth does not contribute.
Anchors can be interconnected with base plates. For this interconnection, a fully nonlinear constraint is used to connect the anchor's end and a base plate node. This constraint allows us to control all degrees of freedom to ensure, for example, that the anchors transfer no compression force from the base plate, or that no shear is transferred by the anchor when modeling a shear lug, etc.
Interconnection with base plate properties for anchors allows the user to control whether the anchor will be connected with the base plate by the previously mentioned constraint and how.
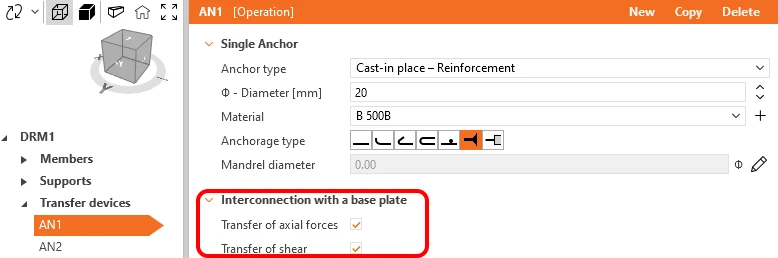
The Transfer of shear checkbox can be used to control whether the anchor and base plate will be connected or not in terms of shear. Note that it is not supported to combine shear transfer mechanisms, so for transfer by friction and shear lug, this checkbox is irrelevant. On the other hand, for shear transfer using anchors, this field gives the option to exclude some anchors from shear transfer.
The Transfer of axial forces checkbox can be used to control whether the anchor and base plate will be connected or not in terms of the axial direction. This is mainly used for the export from the Connection feature (see the corresponding chapter). For manual modeling, it makes sense to have this checkbox always checked.
When the checkbox is unchecked, the anchor is disconnected in both tension and compression (in the case of a model exported from the Connection application, the connection is replaced by a pair of forces). If the checkbox is checked, the anchor is always connected to the plate in tension, but the connection in compression is controlled by the anchor type and the type of stand-off. For more information, see Figure 2.3.8.
Cut threads
Controlled by a checkbox in anchor properties and has 2 purposes:
1. Defines how the anchor connects to the base plate:
- For headed studs and cast-in reinforcement connected to the Base plate (not for Cast-in plates), it distinguishes between a bolt connection (pinned) and a welded connection (fixed) — visible in the 3D scene.
- Note that the way of anchor-to-plate connection has a significant influence on the shear resistance from the point of view of bearing of the concrete.
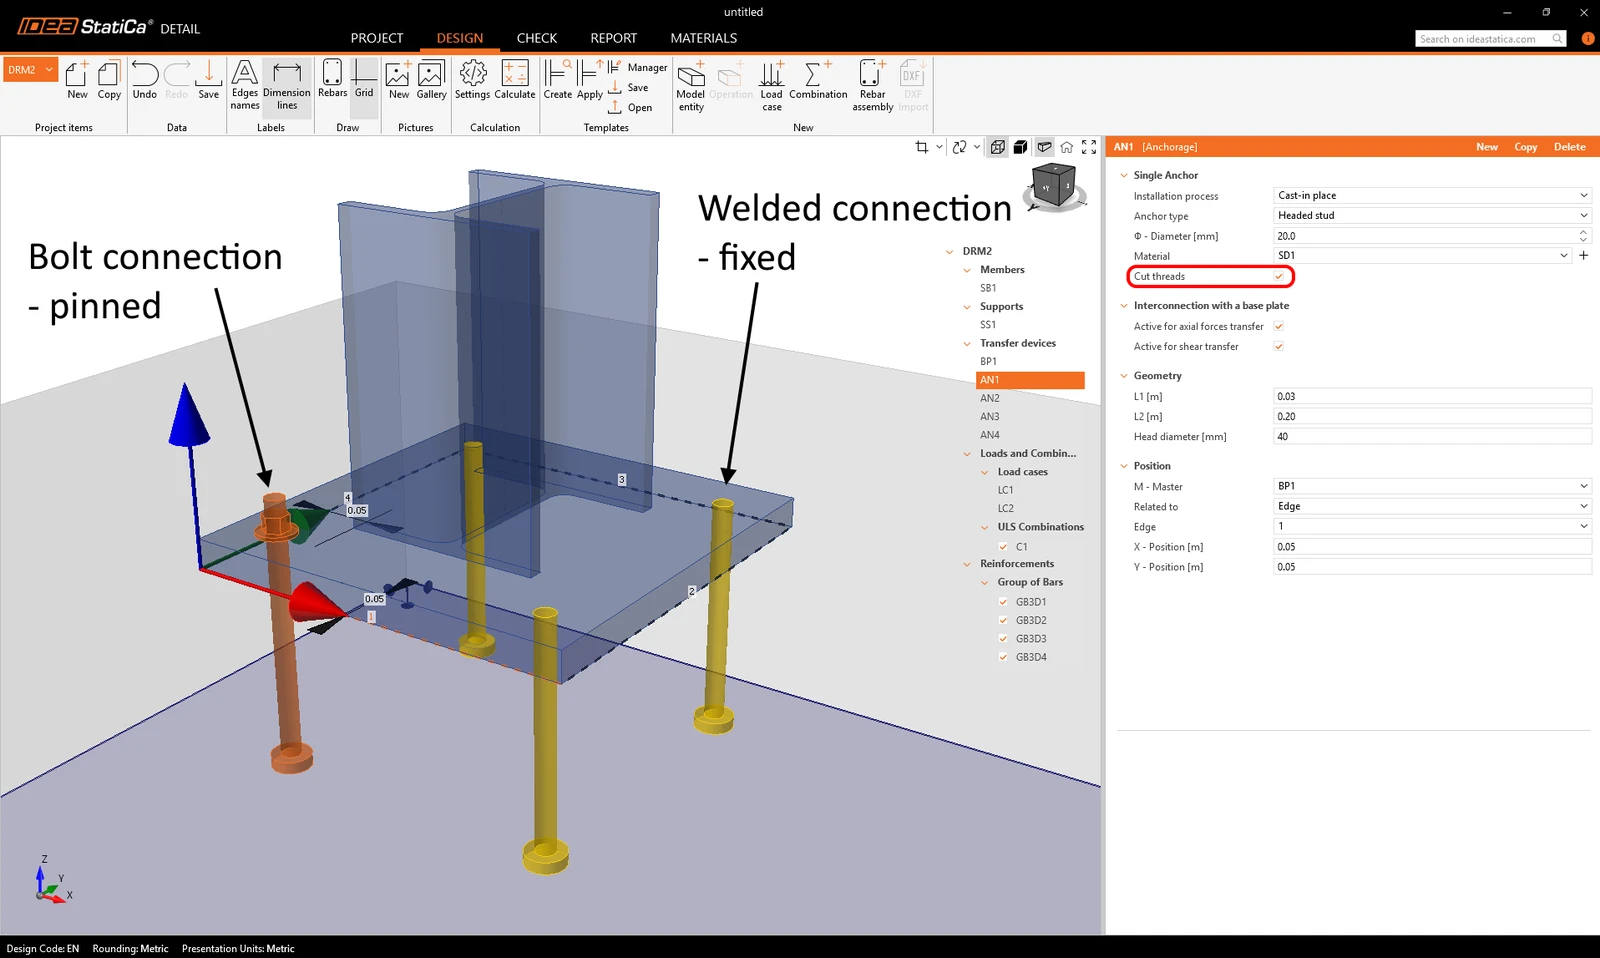
2. For Eurocode, the resistance of the anchor with cut threads is reduced according to EN 1993-1-8 3.6.1 (3). It can be set in Project settings. For Threaded rods and Washer plates, it is recommended to keep this setting on at all times.
Axial and rotational interconnection between Anchor and Base plate
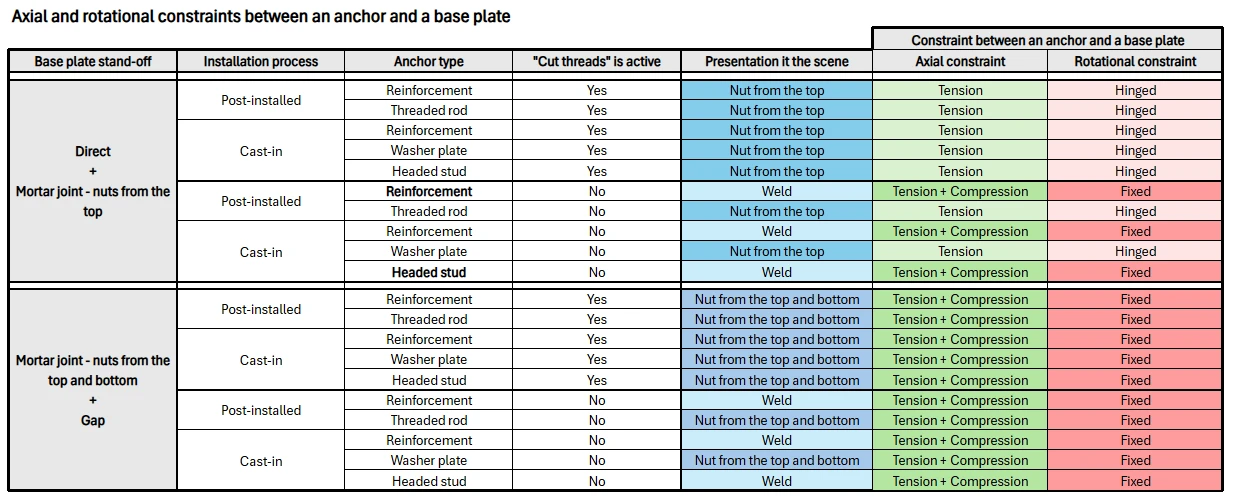
As already mentioned in this chapter, depending on the type of anchor, the stand-off setting, and whether or not cut threads are considered, anchors are connected to the base plate in different ways. In terms of rotational connection, this can be Hinged / Fixed. In terms of axial connection, this can be Tension / Tension + Compression. The rotational connection types strongly influence the shear capacity from the point of view of concrete bearing. In a 3D scene, it is easy to tell whether an anchor is connected as fixed or hinged based on the presence of nuts, see Figure 2.3.10.
The following table shows all possible combinations of base plate connections with anchors and the corresponding rotational and axial connections.
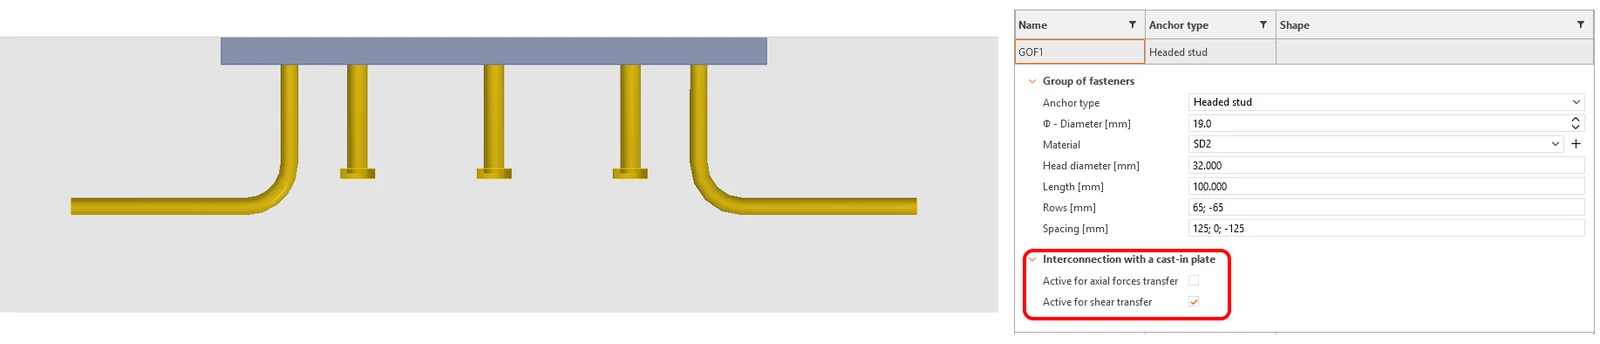
Cast-in plates
Cast-in plate is a special case of a base plate. It is modeled analogously with the following differences:
Since the plate is embedded inside a concrete block, no type of stand-off can be specified. The depth of the slab embedding is neglected. The plate, modeled by shell elements, is placed directly on the concrete surface. Therefore, the side surfaces of the slab are not considered to be supported by the concrete.
It is only possible to use Reinforcement and Headed studs, which, like classic anchors, can be set to be connected to the slab in the axial and shear directions. Practical experience and some national documents indicate the need to design Headed studs only for shear and Reinforcement for axial load. From the perspective of axial and rotational constraints, anchors are always connected as Fixed and Tension + Compression.
2.4 Concrete Meshing in 3D CSFM
The finite elements are implemented internally, and the analysis model is generated automatically without any need for proficient user interaction. An important part of this process is meshing.
Concrete
All concrete members are meshed together. A recommended element size is automatically computed by the application based on the size and shape of the structure and taking into account the diameter of the largest reinforcing bar. Moreover, the recommended element size guarantees that a minimum of four elements are generated in thin parts of the structure, such as slender columns or thin walls, to ensure reliable results in these areas. Designers can always select a user-defined concrete element size by modifying the multiplier of the default mesh size.
Reinforcement
The reinforcement is divided into elements with approximately the same length as the concrete element size. Once the reinforcement and concrete meshes are generated, they are interconnected with bond elements, as shown in Fig. 2.2.1.
Refinement
Concrete mesh is automatically refined around anchors, around shear lugs, and under the stub for loading. The size of the refined mesh is approximately twice smaller than the basic concrete mesh. The radius of the refined area is defined approximately as the element size multiplied by two.
2.5 The solution method and load-control algorithm for 3D CSFM
A standard full Newton-Raphson (NR) algorithm is used to find the solution to a non-linear FEM problem.
Generally, the NR algorithm does not often converge when the full load is applied in a single step. A usual approach, which is also used here, is to apply the load sequentially in multiple increments and use the result from the previous load increment to start the Newton solution of the subsequent one. For this purpose, a load control algorithm was implemented on top of the Newton-Raphson. In the case that the NR iterations do not converge, the current load increment is reduced to half its value, and the NR iterations are retried.
A second purpose of the load-control algorithm is to find the critical load, which corresponds to certain “stop criteria” – specifically the maximum strain in concrete, the maximum slip in bond elements, the maximum displacement in anchorage elements, and the maximum strain in reinforcing bars. The critical load is found using the bisection method. In the case where the stop criterion is exceeded anywhere in the model, the results of the last load increment are discarded and a new increment of half the size of the previous one is calculated. This process is repeated until the critical load is found with a certain error tolerance.
For concrete, the stop criterion was set to a 5% strain in compression (i.e., around an order of magnitude larger than the actual failure strain of concrete) and 7% in tension at the integration points of shell elements. In tension, the value was set to allow for the limit strain in reinforcement, which is usually around 5% without accounting for tension stiffening, to be reached first. In compression, the value was chosen from among several alternatives as one that is large enough for the effects of crushing to be visible in the results, but small enough so as not to cause too many problems with numerical stability.
For reinforcement, the stop criterion is defined in terms of stresses. Since stresses at the crack are modeled, the criterion in tension corresponds to the reinforcement tensile strength accounting for the safety coefficient. The same value is used for the criterion in compression.
The stop criterion in bond elements and anchorage springs is α·δumax, where δumax is the maximum slip used in code checks and α = 10.
Other stop criteria for anchoring:
- Pull out of headed anchors (maximal contact compression stress at the top face of the head of the anchor).
- Maximal shear force that can be transferred by the anchor from the point of view of the bearing of concrete.
These two criteria are dependent on the selected code. You can find more information about them in the sections explaining the code-dependent parts of structural analysis in the application.
2.6 Presentation of 3D results
The results are presented independently for concrete and for reinforcement elements. The stress and strain values in concrete are calculated at the integration points of volume elements. However, as it is not practical to present the data in such a manner, the results are presented by default in nodes, like the maximum value of compressive stress from adjacent Gauss integration points in connected elements. It should be noted that this representation might locally underestimate the results at compressed edges of members in a case where the finite-element size is similar to the depth of the compression zone.
The results for the reinforcement finite elements are either constant for each element (one value – e.g., for steel stresses) or linear (two values – for bond results). For auxiliary elements, such as elements of bearing plates, only deformations are presented.
2.7 Model imported from IDEA StatiCa Connection
The IDEA StatiCa Detail model does not always have to be modeled from scratch or from a template. There is also an option to import the model, including load effects, from IDEA StatiCa Connection. In Connection, the steel superstructure above the concrete block is analyzed using a nonlinear 3D model, while the concrete block itself is represented in a simplified way by a Winkler foundation. In Detail, on the other hand, the reinforced concrete block is modeled explicitly and checked in detail.
When transferring the model, only the base plate, anchors, and concrete block are imported into Detail – the steel member itself (and its global stiffness) is not. In the Connection model, this steel member is connected to the base plate by a weld. The stresses in the weld finite elements are integrated and converted into a set of equivalent forces that load the base plate in Detail. In this way, the effect of the missing steel member is represented by weld forces applied directly to the base plate.
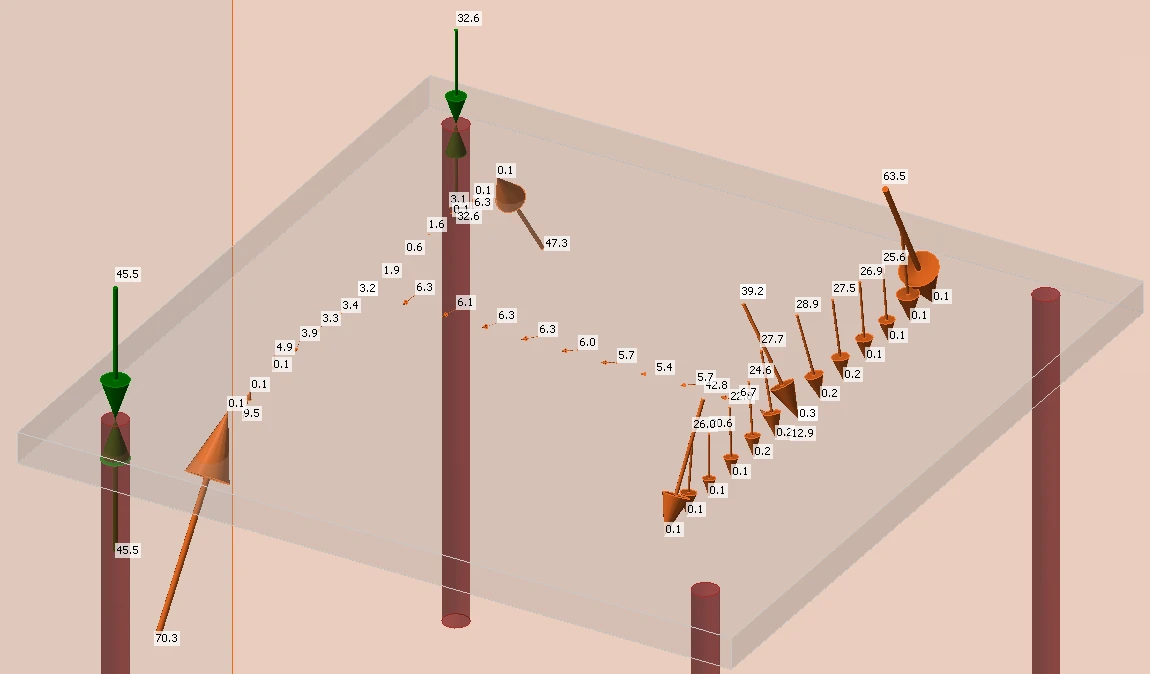
Due to the different definition of stiffness between Connection and Detail (missing steel member, different material models, and concrete representation), a direct connection between the base plate and anchors in Detail would generally lead to a different redistribution of loads and, therefore, different tensile forces in the anchors. To avoid this, the anchors are imported axially disconnected from the base plate. Instead of transferring axial forces through the physical contact, the anchor tensions obtained from the Connection are applied directly to the anchors in Detail. At the same time, an equal and opposite force is applied to the base plate at each anchor location, so that the global equilibrium of the model is preserved. This pair of forces (one acting on the anchor, the other on the base plate) represents the interaction between the base plate and the anchor without allowing additional redistribution of axial forces in Detail. These two opposite forces are illustrated in Figure 2.7.1.
However, the shear forces are still transferred by the connection between the base plate and the anchors (or shear lug, or friction). This is possible because a constraint is used to connect the base plate and the anchors in shear, allowing us to control the relevant degrees of freedom of this interconnection. In Detail, the user can therefore modify the shear load path – for example, by releasing shear in two of four anchors and keeping only the edge anchors engaged in shear – while the axial forces remain as imported from Connection.
For cast-in plates, we adopted a different approach. Several European design recommendations require that only the reinforcement bars are considered to resist axial forces, while headed studs are assumed to transfer shear only. Since IDEA StatiCa Connection cannot internally separate axial forces in reinforcement anchors from those in headed studs during the export, the anchors of cast-in plates are imported into Detail fully connected, also in the axial direction. This allows the user to activate a design option in Detail where reinforcement anchors carry only axial tension and headed studs carry only shear. In this workflow, the axial force that was originally assigned to the headed studs has to be redistributed onto the reinforcement anchors within the Detail model. Such redistribution would not be possible if we used the pair-of-opposite-forces approach described above, which is why cast-in plates are handled differently.
3 Model verification
3.1 Limit states
Ultimate limit state
The different verifications required by specific design codes are assessed based on the direct results provided by the model. ULS verifications are carried out for concrete strength, reinforcement strength, and anchorage (bond shear stresses).
To ensure a structural element has an efficient design, it is highly recommended to run a preliminary analysis that takes into account the following steps:
- Choose a selection of the most critical load combinations.
- Calculate only Ultimate Limit State (ULS) load combinations.
- To expedite the calculation time and address any issues, consider using a coarse mesh by increasing the multiplier of the default mesh size in the Setup (Fig. 3.1.1). If the model performs well, revert the multiplier back to a factor of 1.

Such a model will calculate very quickly, allowing designers to review the detailing of the structural element efficiently and re-run the analysis until all verification requirements are fulfilled for the most critical load combinations. Once all the verification requirements of this preliminary analysis are fulfilled, it is suggested that the complete ultimate load combinations be included and the use of fine mesh size (the mesh size recommended by the program). Users can change mesh size by the multiplier, which can reach values from 0.5 to 5 (Fig. 3.1.1).
The basic results and verifications (stress, strain, and utilization (i.e., the calculated value/limit value from the code)), as well as the direction of principal stresses in the case of concrete elements) are displayed by means of different plots where compression is generally presented in red and tension in blue. Global minimum and maximum values for the entire structure can be highlighted as well as minimum and maximum values for every user-defined part. In a separate tab of the program, advanced results such as tensor values, deformations of the structure, and reinforcement ratios (effective and geometric) used for computing the tension stiffening of reinforcing bars can be shown. Furthermore, loads and reactions for selected combinations or load cases can be presented.
4 Structural verifications according to EUROCODE
4.1 Material models in 3D CSFM (EN)
Concrete - ULS
The concrete model implemented in 3D CSFM is based on the uniaxial compression constitutive laws prescribed by EN 1992-1-1 for the design of cross-sections, which only depend on compressive strength. The parabola-rectangle diagram specified in EN 1992-1-1 Cl. 3.1.7 (1) (Fig. 4.1.1a) is used by default in 3D CSFM, but designers can also choose a more simplified elastic ideal plastic relationship according to EN 1992-1-1 Cl. 3.1.7 (2) (Fig. 4.1.1b). The tensile strength is neglected, as it is in classic reinforced concrete design.
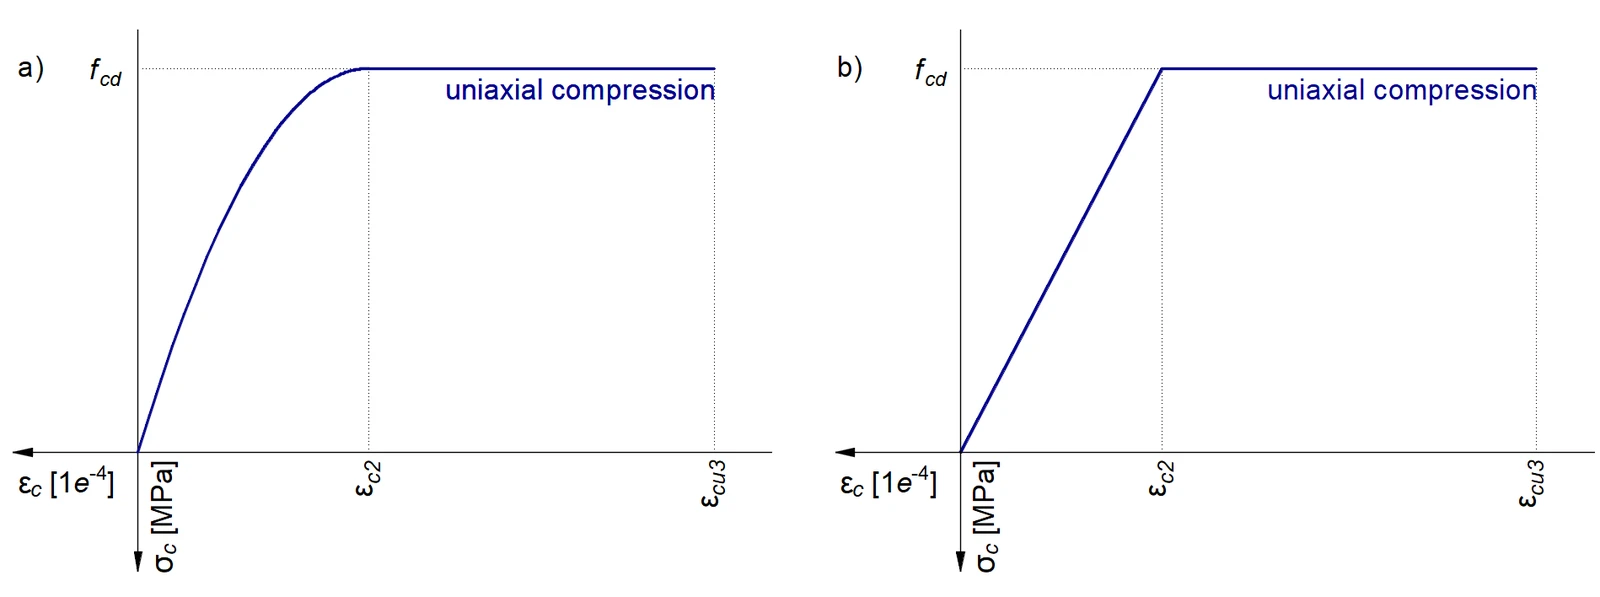
The implementation of 3D CSFM in IDEA StatiCa Detail does not consider an explicit failure criterion in terms of strains for concrete in compression (i.e., after the peak stress is reached, it considers a plastic branch with εcu2 (εcu3) in a value of 5% while EN 1992-1-1 assumes ultimate strain less than 0.35%). This simplification does not allow the deformation capacity of structures failing in compression to be verified. However, their ultimate capacity fcd according to EN 1992-1-1 3.1.3 is properly predicted when the increase in the brittleness of concrete as its strength rises is considered by means of the reduction factor defined in fib Model Code 2010 as follows:
where:
αcc is the coefficient taking account of long-term effects on the compressive strength and of unfavorable effects resulting from the way the load is applied. It is according to EN 1992-1-1 Cl. 3.1.6 (1). The default value is 1.0.
fck is the concrete cylinder characteristic strength (in MPa for the definition of ).
Reinforcement
By default, the idealized bilinear stress-strain diagram for the bare reinforcing bars defined in EN 1992-1-1, section 3.2.7 (Fig. 4.1.2) is considered. The definition of this diagram only requires the basic properties of the reinforcement to be known during the design phase (strength and ductility class). Whenever known, the actual stress-strain relationship of the reinforcement (hot-rolled, cold-worked, quenched, and self-tempered, …) can be considered. The reinforcement stress-strain diagram can be defined by the user, but in this case, it is impossible to assume the tension stiffening effect (it is impossible to calculate crack width). Using the stress-strain diagram with a horizontal top branch does not allow for the verification of structural durability. Therefore, manual verification of standard ductility requirements is necessary.

Tension stiffening (Fig. 4.1.3) is accounted for automatically by modifying the input stress-strain relationship of the bare reinforcing bar in order to capture the average stiffness of the bars embedded in the concrete (εm).

4.2 Partial safety factors
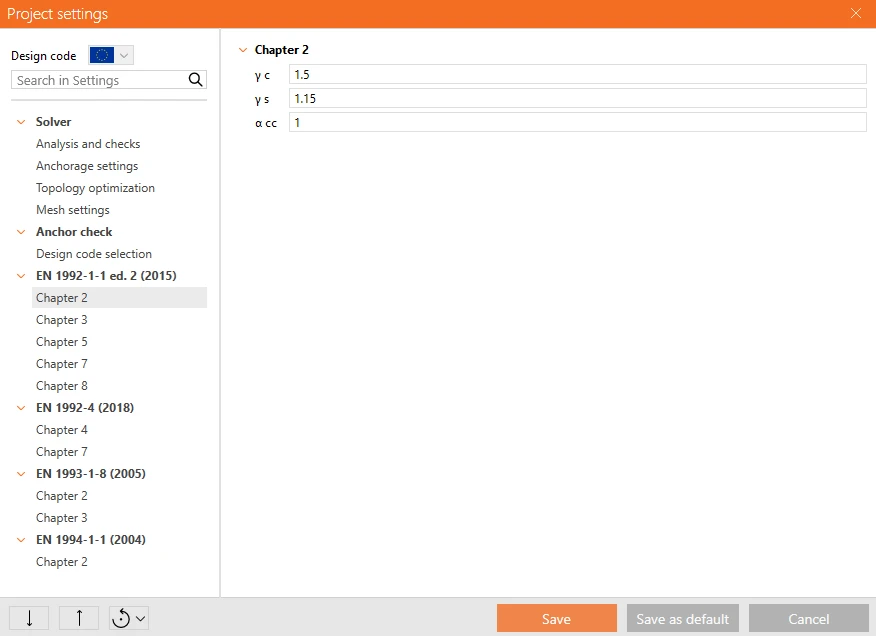
The Compatible Stress Field Method is compliant with modern design codes. As the calculation models only use standard material properties, the partial safety factor format prescribed in the design codes can be applied without any adaptation. In this way, the input loads are factored, and the characteristic material properties are reduced using the respective safety coefficients prescribed in design codes, exactly as in conventional concrete analysis. Values of material safety factors prescribed in EN 1992-1-1 chap. 2.4.2.4 and factors for anchors prescribed in EN 1992-4, EN 1993-1-8, and EN 1994-1-1 are set by default, but the user can change safety factors in the Code and calculation settings (Fig. 4.2.1).
Load safety factors have to be defined by the user in Combination rules for each non-linear combination of load cases (Fig. 4.2.2). For all templates implemented in Idea StatiCa Detail, partial safety factors are already predefined.
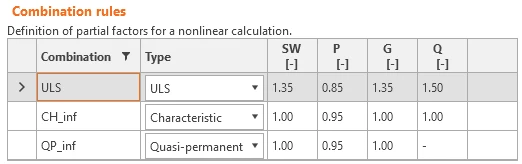
By using appropriate user-defined combinations of partial safety factors, users can also compute with 3D CSFM using the global resistance factor method (Navrátil, et al. 2017), but this approach is hardly ever used in design practice. Some guidelines recommend using the global resistance factor method for non-linear analysis. However, in simplified non-linear analyses (such as 3D CSFM), which only require those material properties that are used in conventional hand calculations, it is still more desirable to use the partial safety format.
4.3 Ultimate limit state checks
The different verifications required by EN 1992-1-1 are assessed based on the direct results provided by the model. ULS verifications are carried out for concrete strength, reinforcement strength, and anchorage (bond shear stresses).
Strength - Concrete
The concrete strength in compression is evaluated as the ratio between the maximum Equivalent principal stress σc,eq obtained from FE analysis and the limit value σc,lim = fcd.
Equivalent Principal Stress expresses the equivalent uni-axial stress for a general tri-axial stress state.
The σc,eq value can, therefore, be directly compared with uniaxial strength limits according to 1992-1-1 Cl. 3.1.7 (1).
This expression is derived from the implementation of the Mohr-Coulomb plasticity theory, conservatively assuming the angle of internal friction φ = 0°.
Strength - Reinforcement
The strength of the reinforcement is evaluated in both tension and compression as the ratio between the stress in the reinforcement at the cracks σsr and the specified limit value σs,lim:
where:
fyk is the yield strength of the reinforcement according to EN 1992-1-1 Cl. 3.2.3,
k is the ratio of tensile strength ftk to the yield stress,
γs is the partial safety factor for reinforcement.
Strength - Anchors
Anchors are checked for normal stresses in a similar way to reinforcement, where the limit value σs,lim is determined.
In addition, the NEd and VEd values are specified for anchors, which are checked against NRd,s and VRd,s according to the selected code. The code is chosen depending on the type of anchor used in Project settings.
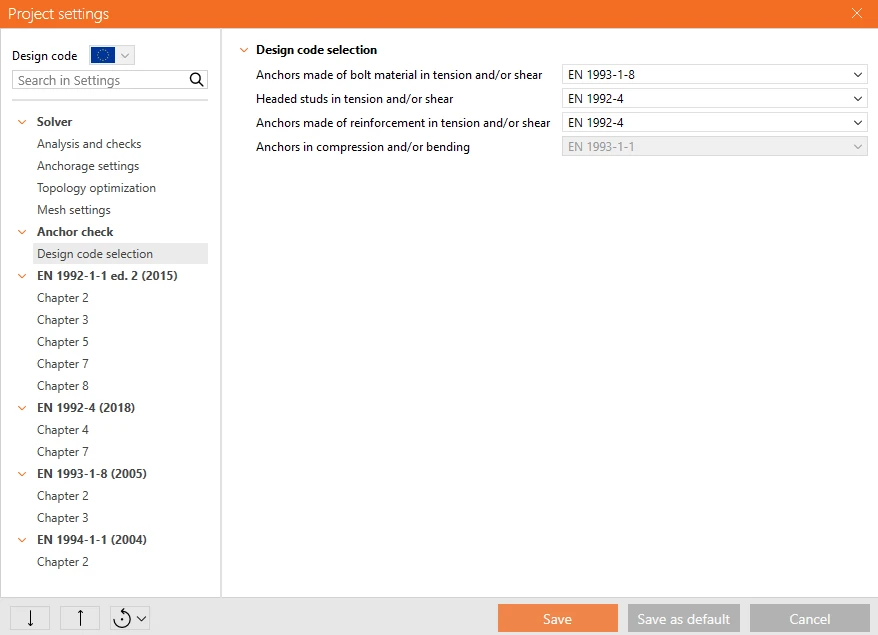
Since different approaches are chosen for checking anchors in different standards, the user can choose the following standards for individual anchor types:
- Anchors made of bolt material in tension and/or shear - EN 1992-4, EN 1993-1-8
- Headed studs in tension and/or shear - EN 1992-4, EN 1994-1-1
- Anchors made in tension and/or shear - EN 1992-4, EN 1992-1-1
- Anchors in compression and/or bending - EN 1993-1-1
Tension check according to EN 1992-4 - 7.2.1.3
where:
- c – reduction for cut threads
- fuk – minimum tensile strength of the bolt
- As – anchor bolt tensile stress area (reduced by the thread in the case of bolt material)
- – partial safety factor for stee
- fyk – minimum yield strength of the bolt
Tension check according to EN 1993-1-8 - 3.6.1
where:
- c – decrease in tensile resistance of bolts with cut thread according to EN 1993-1-8 – Cl. 3.6.1. (3)
- k2 = 0.9 – factor for non-countersunk anchors
- fub – anchor bolt ultimate tensile strength
- As – anchor bolt tensile stress area (reduced by the thread in the case of bolt material)
- γM2 =1.25 – partial safety factor for bolts (EN 1993-1-8, Table 2.1)
Tension check according to EN 1992-1-1 - 3.2.7
where:
- is given in Annex C
- fyk - characteristic yield strength
- γM2 =1.15 – partial safety factor for reinforcement
Compression check according to EN 1993-1-1 - 6.3
Used for all anchors subjected to a normal compression force, regardless of their material or stand-off type.
Where:
- – buckling reduction factor
- – value to determine buckling reduction factor χ
- – imperfection factor for buckling curve c (belonging to the full circle)
- – relative slenderness
- As – the anchor area reduced by threads
- – Euler's critical force
- – moment of inertia of the bolt
- ds – anchor diameter reduced by threads
- – buckling length; it is assumed on the safe side that the bolt is fixed in the concrete and able to rotate at the base plate freely
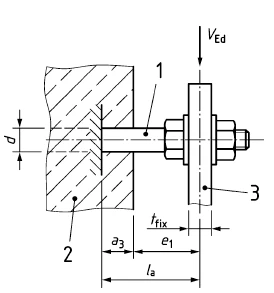
- – length of the bolt element equal to half the base plate thickness + gap + half the bolt diameter; it is assumed on the safe side that the washer and a nut are not clamped to the concrete surface (ETAG 001 – Annex C – Cl. 4.2.2.4), see Figure 4.3.2.
Shear check according to EN 1992-4 - 7.2.2.3
For stand-off = direct, the shear without lever arm is assumed (EN 1992-4 – Cl. 7.2.2.3.1):
For stand-off = mortar joint, the shear with lever arm is assumed (EN 1992-4 – Cl. 7.2.2.3.2):
where:
- k6 = 0.6 for anchors with fuk ≤ 500 MPa; k6 = 0.5 otherwise
- As – shear area of anchor reduced by threads
- fuk – anchor bolt ultimate strength
- αM = 2 – full restraint is assumed (EN 1992-4 – Cl. 6.2.2.3)
- – characteristic bending resistance of the anchor decreased by the tensile force in the anchor
- – characteristic bending resistance of the anchor (ETAG 001, Annex C – Equation (5.5b))
- – section modulus of the anchor
- d – anchor bolt diameter; if the shear plane in a thread is selected (which always is for threaded rod), the diameter reduced by threads is used; otherwise, nominal diameter, dnom, is used
- NEd – tensile force in the anchor
- NRd,s – tensile resistance of the anchor
- – lever arm
- tmortar – thickness of mortar (grout)
- tbp – thickness of the base plate
- for and ; γMs = 1.5 otherwise – partial safety factor for steel failure (EN 1992-4 – Table 4.1)
Shear check according to EN 1993-1-8 - 6.2.2
Anchor shear steel resistance is determined according to EN 1993-1-8 – 6.2.2 (7) regardless of direct or mortar joint stand-off. The grout strength and thickness should be according to Cl. 6.2.5 (7).
where:
- αv = 0.6 for grades 4.6, 5.6, 8.8, and 0.5 for grades 4.8, 5.8, 6.8, 10.9
- fub – ultimate tensile strength of the bolt material
- A – tensile stress area of the bolt, A = As, where As is the tensile stress area of the bolt (reduced by the thread)
- γM2 – safety factor - EN 1993-1-8 – Table 2.1
-
- αb is a coefficient depending on the yield strength of the anchor bolt
- fyb – anchor yield strength; 235 MPa ≤ fyb ≤ 640 MPa
- fub – anchor tensile strength
- As – tensile stress area (reduced by the thread)
Shear check according to EN 1993-1-1 - 6.2.6
These code checks are applied to anchors that are connected to the base plate with a gap or a directly loaded anchor with a projected length more than 0.5 times their diameter.
where:
- AV = 0.844 As – shear area
- As – bolt area reduced by threads
- fy – bolt yield strength
- γM2 – partial safety factor (defined in the Project settings)
Shear check according to EN 1994-1-1 - 6.6.3.1
where:
- γv is the partial factor for shear connection per EN 1994-1-1 chap. 2.4.1.2. The recommended value for γv is 1.25
- d is the diameter of the shank of the stud, 16 mm ≤ d ≤ 25 mm;
- fu is the specified ultimate tensile strength of the material of the stud, but not greater than 500 MPa.
In EN 1994-1-1, clause 6.6.3.1 also provides Equation (6.19), which limits the shear resistance of a stud by the punching (bearing) capacity of the concrete. In IDEA StatiCa Detail, this failure mode is not checked by a separate code formula in the post-processing. Instead, it is built directly into the nonlinear finite element analysis as a stop criterion: the analysis is terminated before the shear force in an anchor reaches the corresponding PRd
from Equation (6.19). This approach is used because Equation (6.19) is valid only for headed studs welded to the steel plate and for stud diameters in the range 16 mm ≤ d ≤ 25 mm, as specified in 6.6.3.1.
To cover a wider range of practical cases, we created a series of 3D reference models in Abaqus with anchor diameters from 8 mm to 50 mm and concrete strengths from C16/20 to C50/60. The studs were modeled either welded rigidly to the base plate or connected by a pinned (hinged) joint. The material models and contact parameters in Detail were then calibrated against these Abaqus simulations, which were themselves verified against Equation (6.19) within its validity range. This stop criterion is valid for all anchor types and all EN codes.
Bending check according to EN 1993-1-1 - 6.2.5
Where:
- – section modulus of the bolt
- ds – anchor diameter reduced by threads
- fy – material yield strength
- γM2 – partial safety factor (defined in the Project settings)
Acting design bending moment MEd - If the shear load acts with a lever arm, a bending moment acting on the fastener shall be accounted for. The design bending moment acting on the fastener is calculated according to EN 1993-1-1 Formula (6.1):
where:
- VEd - is the shear load acting on the fastener under consideration
- la = a3 + e1
- a3 = 0.5dnom, where dnom is the anchor diameter
- e1 - is the distance between the shear load and the concrete surface, neglecting the thickness of any levelling grout
- αM = 2 – full restraint is assumed (EN 1992-4 – Cl. 6.2.2.3)
Interaction of tension and shear in anchor steel
The interaction of tension and shear per EN 1993-1-8 is implicitly included in the anchor shear check.
The interaction of tension and shear per EN 1992-4 is determined separately for steel and concrete failure modes according to Table 7.3. The interaction in steel is checked for each anchor separately.
EN 1994-1-1 states in Article 6.6.3.2 that if the anchor tensile force is greater than 0.1PRd, the check is not covered by this standard. In such a case, the interaction is assessed in accordance with EN 1992-4 in the application. In such a case, the shear check should not be considered according to EN 1994-1-1.
Interaction of tension or compression and bending in anchor steel EN 1993-1-1 - 6.2.1
where:
- NEd – tensile (positive) or compressive (negative sign) design force
- NRd – tensile (positive, Ft,Rd) or compressive (negative sign, Fc,Rd) design resistance
- MEd – design bending moment
- MRd = Mpl,Rd – design bending resistance
Pull-out check for headed anchors (Washer plates and Headed studs)
For headed anchors, an additional stop criterion is implemented to check the concrete bearing (crushing) above the anchor head - pull-out. During the analysis, the compressive force transferred through the head-to-concrete contact is monitored and compared with the limit value given by EN 1992-4, Clause 7.2.1.5 (pull-out failure of headed fastenings).
where:
- Ah is the load bearing area of the head of the fastener (without the shank area).
- fck is the characteristic compressive strength of concrete - EN 1992-1-1 Cl. 3.1.2
- γMp is taken in the application as γMp = γc with the default value of 1.5
- k2 is always taken as 7.5, i.e. the value for cracked concrete. This is consistent with the CSFM approach used in Detail, where the tensile strength of concrete is neglected and the concrete is assumed to be cracked in tension.
Once the contact force reaches this code-based limit, the stop criterion is triggered and the analysis is terminated before the design pull-out resistance is exceeded.
Anchorage - Bond stress
The bond shear stress is evaluated independently as the ratio between the bond stress τb calculated by FE analysis and the ultimate bond strength fbd, according to EN 1992-1-1 chap. 8.4.2:
where:
- fctd is the design value of concrete tensile strength according to EN 1992-1-1 Cl. 3.1.6 (2). Due to the increasing brittleness of higher-strength concrete, fctk,0.05 is limited to the value for C60/75 according to EN 1992-1-1 Cl. 8.4.2 (2)
- η1 is a coefficient related to the quality of the bond condition and the position of the bar during concreting (Fig. 4.3.3).
- η1 = 1.0 when ‘good’ conditions are obtained and
- η1 = 0.7 for all other cases and for bars in structural elements built with slip-forms, unless it can be shown that ‘good’ bond conditions exist
- η2 is related to the bar diameter:
η2 = 1.0 for Ø ≤ 32 mm
η2 = (132 - Ø)/100 for Ø > 32 mm

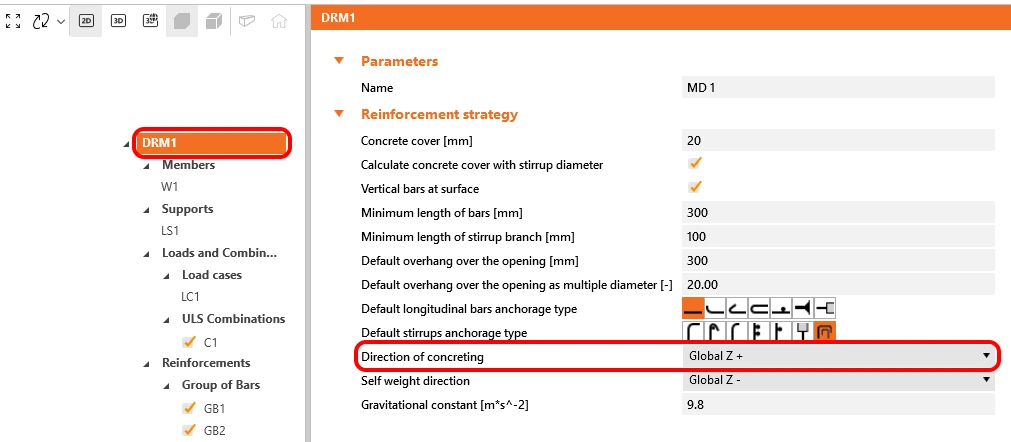
In IDEA StatiCa Detail, the bond conditions are taken into account according to Fig. 4.3.3 c) and d). The direction of concreting can be set in the application for each project item as follows:
These verifications are carried out with respect to the appropriate limit values for the respective parts of the structure (i.e., in spite of having a single grade both for concrete and reinforcement material, the final stress-strain diagrams will differ in each part of the structure due to tension stiffening and compression softening effects).
Anchorage - Total force
Total force Ftot and Limit force Flim
The total force Ftot is a result of the finite element analysis and can be defined in two ways.
where As is the area of the reinforcement bar and σs is the stress in the bar.
Or as a sum of the anchorage force Fa and the bond force Fbond.
where Fa is the actual force in the anchorage spring and Fbond is the bond force that can be obtained by integrating the bond stress τb along the length of reinforcement bar l.
Cs is the circumference of the reinforcement bar.
The limit force Flim is the maximum force in the element of the rebar considering the ultimate strength of the rebar and also anchoring conditions (bond between concrete and reinforcement and anchorage hooks, loops, etc.).
where Cs is the circumference of the reinforcement bar, and l is the length from the beginning of the rebar to the point of interest.
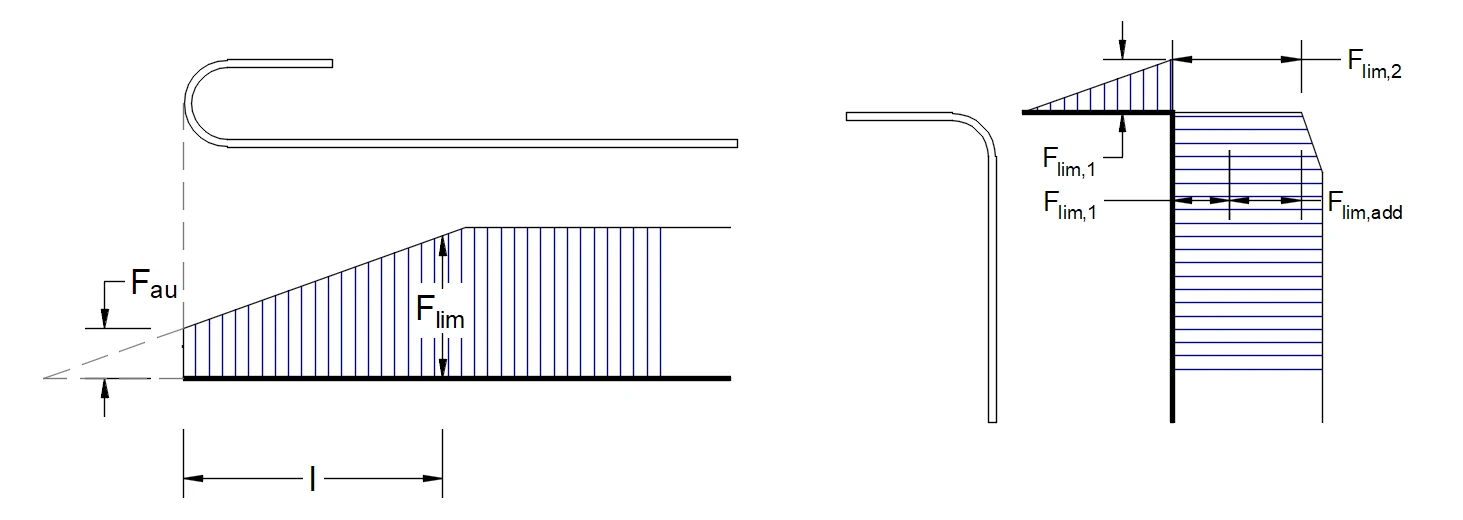
where Flim,add is the additional force calculated from the magnitude of the angle between neighboring elements. Flim,2 must always be lower than Fu.
Anchorage types at the end of Reinforcement (Anchors and Rebars)
The available anchorage types in 3D CSFM include a straight bar (i.e., no anchor end reduction), bend, hook, loop, welded transverse bar, perfect bond, and continuous bar. All these types, along with the respective anchorage coefficients β, are shown in Fig. 4.3.6 for longitudinal reinforcement and in Fig. 4.3.7 for stirrups. The values of the adopted anchorage coefficients are in accordance with EN 1992-1-1 section 8.4.4 Tab. 8.2. It should be noted that in spite of the different available options, 3D CSFM distinguishes three types of anchorage ends: (i) no reduction in the anchorage length, (ii) a reduction of 30% of the anchorage length in the case of a normalized anchorage, and (iii) perfect bond.


In order to comply with EN 1992-1-1, the anchorage spring should be used in the calculation, the anchorage spring is modified by the β coefficient, so the user must use one of the available anchorage types when defining the reinforcement start and end conditions.
5 Structural verifications according to ACI 318-19
3D CSFM is in accordance with ACI 318-19, chapter 6.8.1.1. In order for the 3D CSFM to meet the requirements from ACI 318-19 Section 6.8.1.2, a lot of verification testing was done at various universities. Individual articles summarizing the results of verification and validation can be found at the following link.
5.1 Material models in 3D CSFM (ACI)
Concrete - Strength
The concrete model implemented for strength calculations in the CSFM is based on the parabolic-plastic stress-strain curve for concrete based on the Portland CementAssociation’s parabolic stress-strain curve described in PCA’s Notes on ACI 318-99 Building Code Requirements for Structural Concrete, Figure 6-8. The tensile strength is neglected, as it is in classic reinforced concrete design.
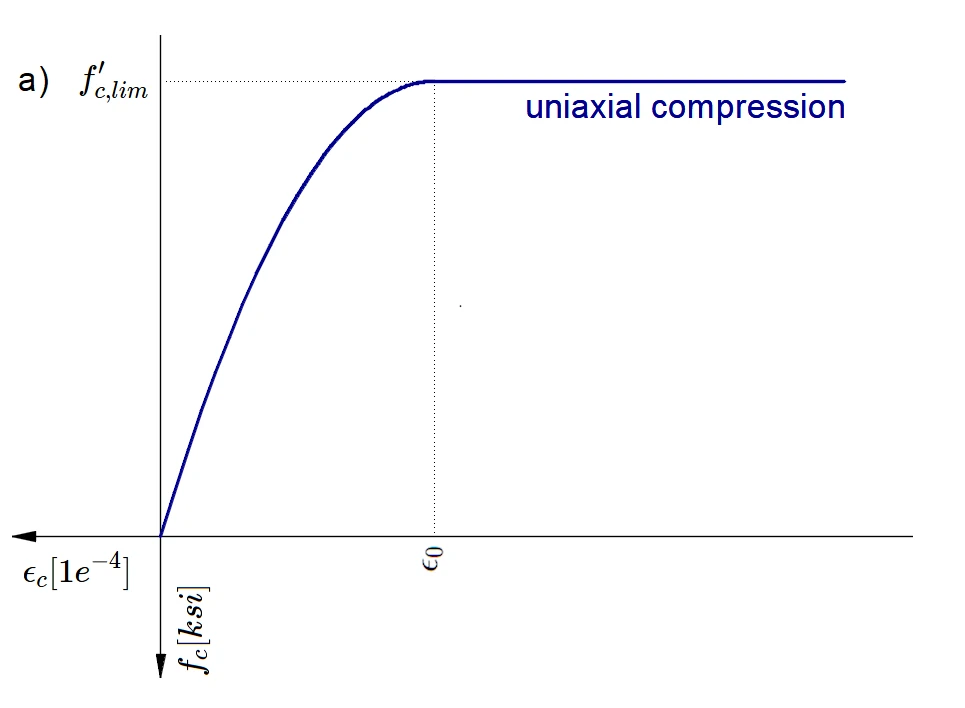
The implementation of the CSFM in IDEA StatiCa Detail does not consider an explicit failure criterion in terms of strains for concrete in compression (i.e., after the peak stress is reached it considers a plastic branch with εc0 in maximum value 5% while ACI 318-19 Cl. 22.2.2.1 assumes ultimate strain less than 0.3%). This simplification does not allow the deformation capacity of structures failing in compression to be verified. However, the strength is properly predicted when the increase in the brittleness of concrete as its strength rises is considered by means of the reduction factor defined in fib Model Code 2010 as follows:
where:
α1 is the Reduction factor of concrete compressive strength defined in ACI 318-19 Cl. 22.2.2.4.1. When using a parabola-rectangle stress-strain diagram, it is necessary to reduce the maximum compressive stress by this factor. This averages the stress distribution in the compression zone in such a way that the resulting compressive strength is less than or equal to the compressive strength calculated using a stress-strain diagram with a decreasing plastic branch.
Φc is the strength reduction factor for concrete. The default value is set according to ACI 318-19 Table 24.2.1 (b)(f).
f'c is the concrete cylinder strength (in MPa for the definition of ).
Reinforcement
A perfectly elasto-plastic stress-strain diagram with a defined yield point for the non-prestresses reinforcement is considered. See ACI 319-19 Cl. 20.2.1. The definition of this diagram only requires the basic properties of the reinforcement to be known - strength and modulus of elasticity.
The reinforcement stress-strain diagram can be also defined by the user, but in this case, it is impossible to assume the tension stiffening effect.
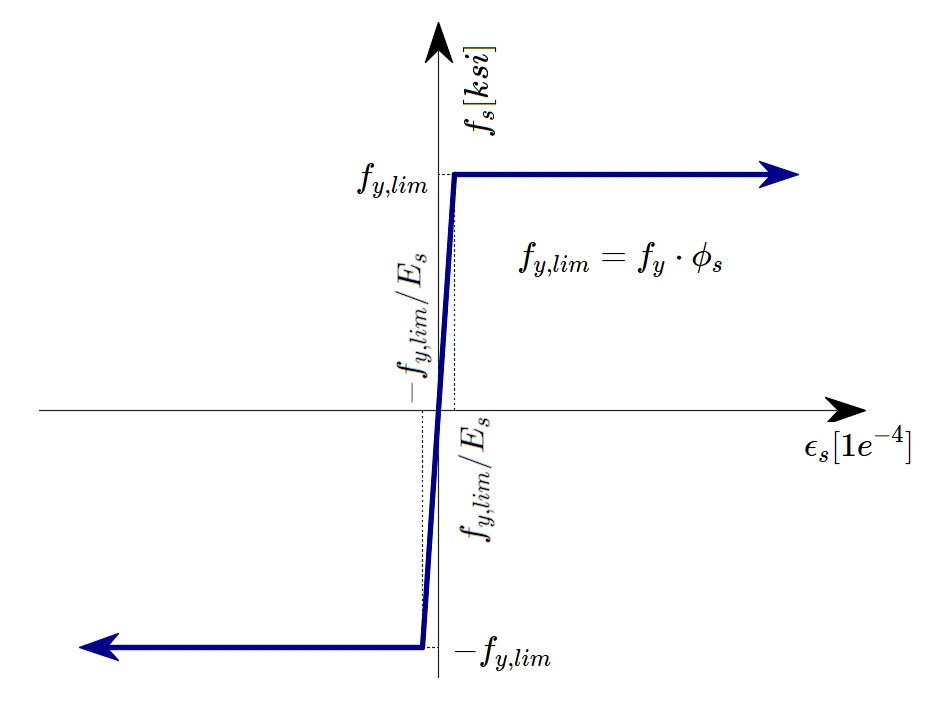
where:
Φs is the strength reduction factor for reinforcement. Where the default value is set according to ACI 318-19 Table 24.2.1.
fy is the yield strength of reinforcement
Es modulus of elasticity of reinforcement
10% is selected as the limit strain at which the calculation is stopped. This is considered safe based on ASTM A955/A955M-20c Article 7.
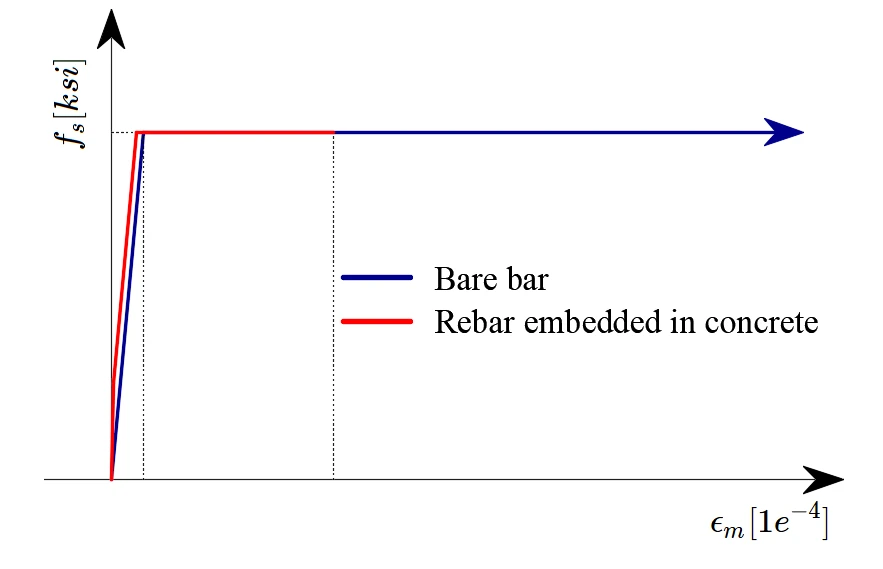
Tension stiffening (Fig. 5.1.3) is accounted for automatically by modifying the input stress-strain relationship of the bare reinforcing bar in order to capture the average stiffness of the bars embedded in the concrete (εm).
5.2 Strength reduction factors and load factors
The Compatible Stress Field Method is compliant with modern design codes. As the calculation models only use standard material properties, the partial safety factor format prescribed in the design codes can be applied without any adaptation. In this way, the input loads are factored, and the characteristic material properties are reduced using the respective strength reduction factors, exactly as in conventional concrete analysis.
Values of strength reduction factors are prescribed in ACI 318-19 chapter 21 and for anchors in ACI 318-19 chapter 17 and AISC 360-16 chapter D, E, F, G.
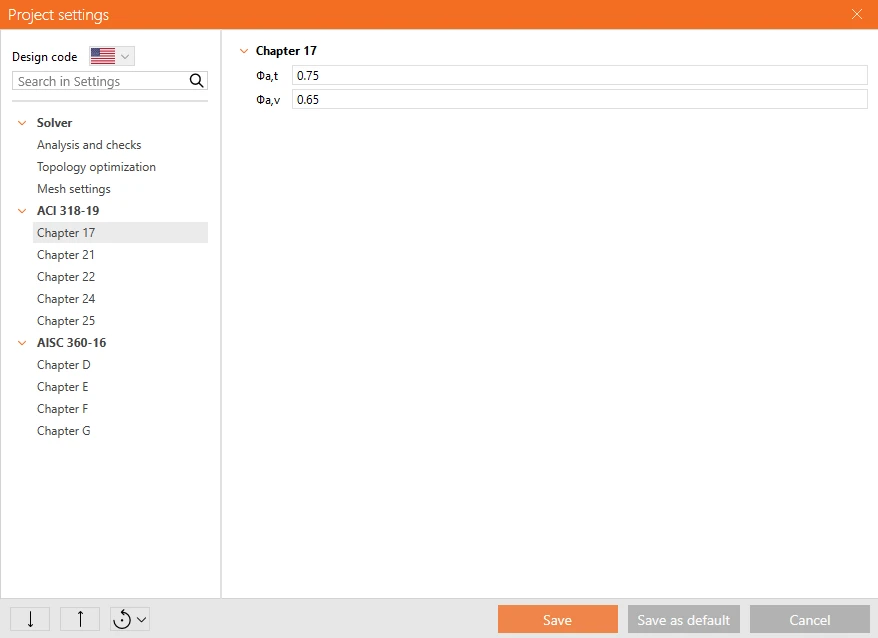
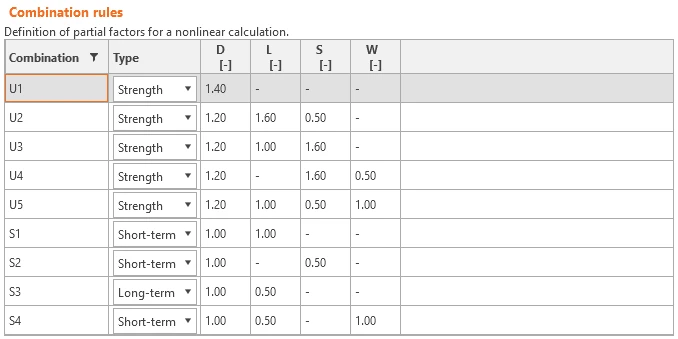
Load factors for Strength combinations shall be defined according to ACI 318-19 Table 5.3.1.
Except as stated in Chapter 34, service-level load combinations are not defined in ACI 318-19. It is recommended to use combination rules based on Appendix C of ASCE/SEI 7-16. For all templates, load factors are already predefined.
5.3 Strength verifications in Detail 3D
The different verifications required by ACI 318-19 are assessed based on the direct results provided by the model. Verifications are carried out for concrete strength, reinforcement strength, and anchorage (bond shear stresses).
Strength - Concrete
The concrete strength in compression is evaluated as the ratio between the maximum Equivalent principal stress fc,eq (also σc,eq in previous text) obtained from FE analysis and the limit value f'c,lim.
Equivalent Principal Stress expresses the equivalent uni-axial stress for a general tri-axial stress state.
The fc,eq value can, therefore, be directly compared with uniaxial strength limits. This expression is derived from the implementation of the Mohr-Coulomb plasticity theory, conservatively assuming the angle of internal friction φ = 0°.
Strength - Reinforcement
The strength of the reinforcement is evaluated in both tension and compression as the ratio between the stress in the reinforcement at the cracks fs and the specified limit value fy,lim.
Strength - Anchors
Anchors are checked for normal stresses in a similar way to reinforcement, where the limit value fy,lim is determined.
To make it easier to navigate the following text, we will first divide anchoring into three groups in terms of code-checking according to ACI or AISC.
Group 1
- Anchorage Types
- Cast-in plate
- Base plate - Stand-off = direct
- Base plate - Stand-off = Mortar joint - thickness of mortar less than 0.5 times the anchor diameter
- Single anchor with projected length less than 0.5 times anchor diameter
- Anchor code-checks (ACI / AISC)
- Tension/compression
- All anchor types in tension – ACI 318-19 chap. 17.6.1.2
- All anchor types in compression – AISC 360-16 chap. E
- Shear without lever arm
- Bolt material – ACI 318-19 chap. 17.7.1.2 (b)
- Headed studs – ACI 318-19 chap. 17.7.1.2 (a)
- Reinforcement – ACI 318-19 chap. 17.7.1.2 (b)
- Interaction of tension and shear - ACI 318-19 chap. 17.8
Group 2
- Anchorage Types
- Base plate - Stand-off = Mortar joint - thickness of mortar more than 0.5 times the anchor diameter
- Anchor code-checks (ACI / AISC)
- Tension/compression
- All anchor types in tension – ACI 318-19 chap. 17.6.1.2
- All anchor types in compression – AISC 360-16 chap. E
- Shear with lever arm
- Bolt material – ACI 318-19 chap. 17.7.1.2 (b) + chap. 17.7.1.2.1.
- Headed studs – ACI 318-19 chap. 17.7.1.2 (a) + chap. 17.7.1.2.1.
- Reinforcement – ACI 318-19 chap. 17.7.1.2 (b) + chap. 17.7.1.2.1.
- Interaction of tension and shear - ACI 318-19 chap. 17.8
Group 3
- Anchorage types
- Base plate - Stand-off = gap
- Single anchor with projected length more than 0.5 times the anchor diameter
- Anchor code-checks (ACI / AISC)
- Tension/compression (with buckling)
- All anchor types in tension – ACI 318-19 chap. 17.6.1.2
- All anchor types in compression – AISC 360-16 chap. E3
- Bending
- For all anchor types – AISC 360-16 chap. F11
- Shear
- For all anchor types – AISC 360-16 chap. G
- Interaction of axial force and bending
Tensile resistance of anchor according to ACI 318-19 chap. 17.6.1.2
where:
- ϕa,t – strength reduction factor for anchors in tension according to ACI 318-19 chap. 17.5.3 (a)
- Ase,N – tensile stress area (reduced by thread)
- futa – specified tensile strength of anchor steel and shall not be greater than 1.9 fya and 860 MPa
Shear resistance of anchor according to ACI 318-19 chap. 17.7.1.2 (a)
The steel strength in shear for headed studs is determined as:
where:
ϕa,v – strength reduction factor for anchors in tension according to ACI 318-19 chap. 17.5.3 (a)
Ase,V – tensile stress area (reduced by thread)
futa – specified tensile strength of anchor steel and shall not be greater than 1.9 fya and 860 MPa
Shear resistance of anchor according to ACI 318-19 chap. 17.7.1.2 (b)
The steel strength in shear for anchors from bolt material and reinforcement is determined as:
where:
- ϕa,v – strength reduction factor for anchors in tension according to ACI 318-19 chap. 17.5.3 (a)
- Ase,V – tensile stress area (reduced by thread)
- futa – specified tensile strength of anchor steel and shall not be greater than 1.9 fya and 860 MPa
Shear resistance of anchor connected to a base with mortar - ACI 318-19 chap. 17.7.1.2.1
If anchors are used with built-up grout pads (Group 2), the design strength calculated in accordance with 17.7.1.2 shall be multiplied by 0.80.
Interaction in tension and shear according to ACI 318-19 chap. 17.8
It shall be permitted to neglect the interaction between tension and shear if (a) or (b) is satisfied.
(a) Nua/(ϕNn) ≤ 0.2
(b) Vua/(ϕVn) ≤ 0.2
If Nua/(ϕNn) > 0.2 for the governing strength in tension and Vua/(ϕVn) > 0.2 for the governing strength in shear, then Eq. (17.8.3) shall be satisfied.
Compressive resistance of anchor according to AISC 360-16 chap. E3
where:
- ϕa,t – the strength reduction factor for anchors in compression according to AISC 360-16 chap. E1
- (a) When: or
- (b) When: or
- Ag – gross cross-sectional area of member
- E – modulus of elasticity of steel
- - elastic buckling stress
- Fy – specified minimum yield stress of the type of steel being used
- – radius of gyration
- – moment of inertia of the bolt
Bending resistance of anchor according to AISC 360-16 chap. F11
where:
- – plastic section modulus of the bolt
- – elastic section modulus of the bolt
Shear resistance of anchor according to AISC 360-16 chap. G
where:
- AV = 0.844As – the shear area
- As – the bolt area reduced by threads
Concrete crushing at the anchor–concrete interface
The anchor shear resistance is also limited from the point of view of concrete crushing at the anchor–concrete interface. The limit values and the method for determining them are described in detail in the article - Shear behaviour of anchors in reinforced concrete. Once the contact force reaches this limit, the stop criterion is triggered, and the analysis is terminated before the resistance is exceeded.
Pull-out check for headed anchors (Washer plates and Headed studs)
For headed anchors, an additional stop criterion is implemented to check the concrete bearing (crushing) above the anchor head - pull-out. During the analysis, the compressive force transferred through the head-to-concrete contact is monitored and compared with the limit value given by ACI 318-19, Clause 17.6.3.2.2a (pull-out failure of headed fastenings).
where:
- is the strength reduction factor - Table 17.5.3(c)
- Abrg net bearing area of the head of stud, anchor bolt, or headed deformed bar (without the shank area).
- f'c is the specified compressive strength of concrete
- is the pullout cracking factor according to 17.6.3.3, and is always taken as 1.0, i.e. the value for cracked concrete. This is consistent with the CSFM approach used in Detail, where the tensile strength of concrete is neglected and the concrete is assumed to be cracked in tension.
Once the contact force reaches this code-based limit, the stop criterion is triggered, and the analysis is terminated before the pull-out resistance is exceeded.
Anchorage - Bond stress
The bond shear stress is evaluated independently as the ratio between the bond stress τb calculated by FE analysis and the bond strength fbu.
Although the bond strength is not explicitly defined in ACI 318-19, the calculation of the development length can be found in Section 25.4.2. However, since the bond strength is the basic input for determining the development length, see R25.4.1.1 and ACI Committee 408 1966, the bond strength can be calculated as follows:
Let us assume that if we anchor the reinforcement bar into a concrete block to the development length ld or greater, pulling out the reinforcement will lead to rupture of the reinforcement and not to pulling out of the concrete. This can be written with the following formula.
where:
db is the diameter of the reinforcement bar, ld is the development length, fbu is the bond strength, fy is the yield strength of the reinforcement, and As is the area of the reinforcement rebar.
From the preceding, the formula for calculating bond strength can be easily derived:
The development length ld is then determined according to ACI 318-19 Table 25.4.2.3 as follows:
where:
C = 25 (2.1 for metric) for no. 6 and smaller bars and deformed wires, C = 20 (1.7 for metric) for no. 7 and larger bars, λ = 1.0 for normal weight concrete, ψt, ψe, ψg are determined according to ACI 318-19 Table 25.4.2.3.
Only uncoated or zinc-coated (galvanized) reinforcement is supported, so ψe = 1.0. ψg is automatically determined from the reinforcement grade, and ψt is automatically derived from the position of the reinforcement in the model and from the direction of concreting that can be set in the application for each project item as follows.
These verifications are carried out with respect to the appropriate limit values for the respective parts of the structure (i.e., in spite of having a single grade both for concrete and reinforcement material, the final stress-strain diagrams will differ in each part of the structure due to tension stiffening and compression softening effects).
Anchorage - Total force
Total force Ftot and limit force Flim
The total force Ftot is a result of the finite element analysis and can be defined in two ways.
where As is the area of the reinforcement bar and fs is the stress in the bar.
Or as a sum of the anchorage force Fa and the bond force Fbond.
where Fa is the actual force in the anchorage spring and Fbond is the bond force that can be obtained by integrating the bond stress τb along the length of reinforcement bar l.
Cs is the circumference of the reinforcement bar.
The limit force Flim is the maximum force in the element of the rebar considering the strength of the rebar and also anchoring conditions (bond between concrete and reinforcement and anchorage hooks, loops, etc.).
where Cs is the circumference of the reinforcement bar, and l is the length from the beginning of the rebar to the point of interest.
where Flim,add is the additional force calculated from the magnitude of the angle between neighboring elements. Flim,2 must be always lower than Fu.
The available anchorage types in CSFM include a straight bar (i.e., no anchor end reduction), 90-degree hook, 180-degree hook, perfect bond, and continuous bar. All these types, along with the respective anchorage coefficients β, are shown in Fig. 5.3.3 for longitudinal reinforcement. The values of the adopted anchorage coefficients are derived from the comparison of the equation from section ACI 318-19 25.4.3.1 and equations taken from section ACI 318-19 25.4.2.3. It should be noted that, in spite of the different available options, CSFM distinguishes three types of anchorage ends: (i) no reduction in the anchorage length, (ii) a reduction of 30% of the anchorage length in the case of a normalized anchorage, and (iii) perfect bond.

The anchorage coefficient for stirrups is always - β = 1.0.
In order to comply with ACI, the anchorage spring should be used in the calculation, the anchorage spring is modified by the β coefficient so the user must use one of the available anchorage types when defining the reinforcement start and end conditions.
6 Structural verifications according to AASHTO
6.1 Material models in 3D CSFM (AASHTO)
Concrete - Strength
The concrete model implemented for strength calculations in 3D CSFM is based on the AASHTO LRFD strength-design assumptions of equilibrium and strain compatibility. In accordance with AASHTO LRFD (2024) Article 5.6.2.1, the tensile strength of concrete is neglected.
The implementation of the 3D CSFM in IDEA StatiCa Detail does not consider an explicit failure criterion in terms of strains for concrete in compression (i.e., after the peak stress is reached, it considers a plastic branch with εc0 in maximum value 5%, while AASHTO LRFD (2024) Article 5.6.2.1 assumes ultimate strain less than 0.3%). This simplification does not allow the deformation capacity of structures failing in compression to be verified. However, the strength is properly predicted when the increase in the brittleness of concrete as its strength rises is considered by means of the reduction factor defined in fib Model Code 2010 as follows:
where:
α1 is the Reduction factor of concrete compressive strength defined in AASHTO LRFD (2024) Article 5.6.2.2. When using a parabola-rectangle stress-strain diagram, it is necessary to reduce the maximum compressive stress by this factor. This averages the stress distribution in the compression zone in such a way that the resulting compressive strength is less than or equal to the compressive strength calculated using a stress-strain diagram with a decreasing plastic branch.
Φc is the strength reduction factor for concrete. The default value is set according to AASHTO LRFD (2024) Article 5.5.4.2.
f'c is the concrete cylinder strength (in MPa for the definition of ).
Reinforcement
A perfectly elasto-plastic stress-strain diagram with a defined yield point for the non-prestresses reinforcement is considered. See AASHTO LRFD (2024) Article 5.4.3. The definition of this diagram only requires the basic properties of the reinforcement to be known - strength and modulus of elasticity.
The reinforcement stress-strain diagram can be also defined by the user, but in this case, it is impossible to assume the tension stiffening effect.
where:
Φs is the strength reduction factor for reinforcement. Where the default value is set according to AASHTO LRFD (2024) Article 5.5.4.2.
fy is the yield strength of reinforcement
Es modulus of elasticity of reinforcement
10% is selected as the limit strain at which the calculation is stopped. This is considered safe based on ASTM A955/A955M-20c Article 7.
Tension stiffening (Fig. 6.1.3) is accounted for automatically by modifying the input stress-strain relationship of the bare reinforcing bar in order to capture the average stiffness of the bars embedded in the concrete (εm).
6.2 Resistance factors and load factors
The Compatible Stress Field Method is compliant with modern design codes. As the calculation models only use standard material properties, the partial safety factor format prescribed in the design codes can be applied without any adaptation. In this way, the input loads are factored, and the characteristic material properties are reduced using the respective strength reduction factors, exactly as in conventional concrete analysis.
Values of strength reduction factors are prescribed in AASHTO LRFD (2024) Article 5.5.4 and for anchors in ACI 318-19 Chapter 17 and AASHTO LRFD (2024) Article 6.5.4.2.
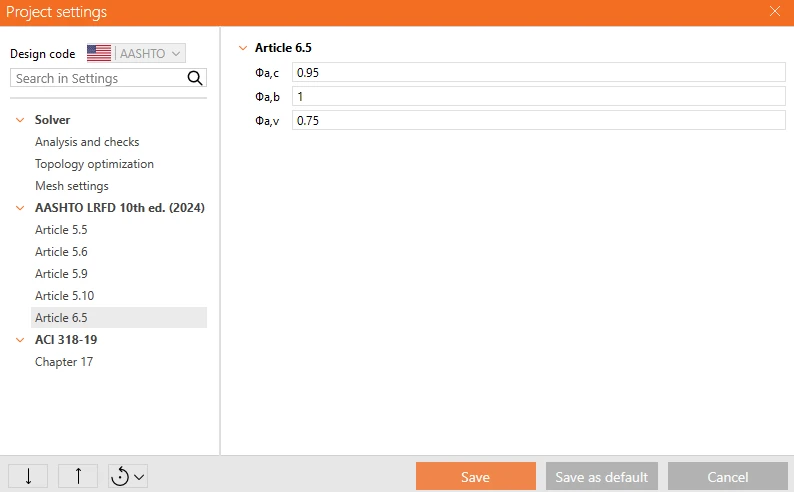
Load factors and load combinations shall be defined according to AASHTO LRFD Bridge Design Specifications (2024), Article 3.4.1 and Tables 3.4.1-1 to 3.4.1-6. AASHTO LRFD explicitly specifies the Strength limit-state load combinations (Strength I to Strength V), including the corresponding load factors for each case.
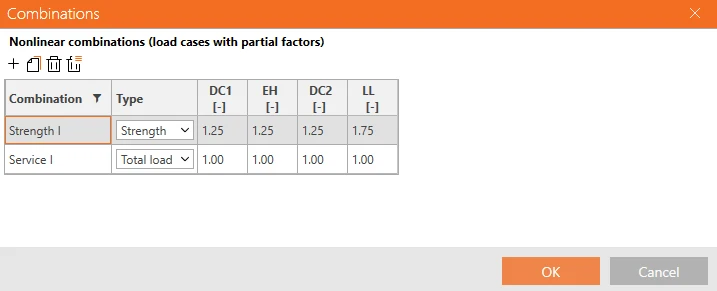
6.3 Strength limit state in Detail 3D
The different verifications required by AASHTO are assessed based on the direct results provided by the model. Verifications are carried out for concrete strength, reinforcement strength, and anchorage (bond shear stresses).
Strength - Concrete
The concrete strength in compression is evaluated as the ratio between the maximum Equivalent principal stress fc,eq (also σc,eq in previous text) obtained from FE analysis and the limit value f'c,lim.
Equivalent Principal Stress expresses the equivalent uni-axial stress for a general tri-axial stress state.
The fc,eq value can, therefore, be directly compared with uniaxial strength limits. This expression is derived from the implementation of the Mohr-Coulomb plasticity theory, conservatively assuming the angle of internal friction φ = 0°.
Strength - Reinforcement
The strength of the reinforcement is evaluated in both tension and compression as the ratio between the stress in the reinforcement at the cracks fs and the specified limit value fy,lim.
Strength - Anchors
Anchors are checked for normal stresses in a similar way to reinforcement, where the limit value fy,lim is determined.
To make it easier to navigate the following text, we will first divide anchoring into three groups in terms of code-checking according to AASHTO or ACI.
Group 1
- Anchorage Types
- Cast-in plate
- Base plate - Stand-off = direct
- Base plate - Stand-off = Mortar joint - thickness of mortar less than 0.5 times the anchor diameter
- Single anchor with projected length less than 0.5 times anchor diameter
- Anchor code-checks (AASHTO / ACI)
- Tension/compression
- All anchor types in tension – ACI 318-19 chap. 17.6.1.2
- All anchor types in compression – AASHTO article 6.9.2
- Shear without lever arm
- Bolt material – ACI 318-19 chap. 17.7.1.2 (b)
- Headed studs – ACI 318-19 chap. 17.7.1.2 (a)
- Reinforcement – ACI 318-19 chap. 17.7.1.2 (b)
- Interaction of tension and shear - ACI 318-19 chap. 17.8
Group 2
- Anchorage Types
- Base plate - Stand-off = Mortar joint - thickness of mortar more than 0.5 times the anchor diameter
- Anchor code-checks (AASHTO / ACI)
- Tension/compression
- All anchor types in tension – ACI 318-19 chap. 17.6.1.2
- All anchor types in compression – AASHTO article 6.9.2
- Shear with lever arm
- Bolt material – ACI 318-19 chap. 17.7.1.2 (b) + chap. 17.7.1.2.1.
- Headed studs – ACI 318-19 chap. 17.7.1.2 (a) + chap. 17.7.1.2.1.
- Reinforcement – ACI 318-19 chap. 17.7.1.2 (b) + chap. 17.7.1.2.1.
- Interaction of tension and shear - ACI 318-19 chap. 17.8
Group 3
- Anchorage types
- Base plate - Stand-off = gap
- Single anchor with projected length more than 0.5 times the anchor diameter
- Anchor code-checks (AASHTO / ACI)
- Tension/compression (with buckling)
- All anchor types in tension – ACI 318-19 chap. 17.6.1.2
- All anchor types in compression – AASHTO LRFD article 6.9.2
- Bending
- For all anchor types – AAHTO LRFD article 6.12.2.2.7
- Shear
- For all anchor types – AASHTO LRFD article 6.10.9
- Interaction of axial force and bending
Tensile resistance of anchor according to ACI 318-19 chap. 17.6.1.2
where:
- ϕa,t – strength reduction factor for anchors in tension according to ACI 318-19 chap. 17.5.3 (a)
- Ase,N – tensile stress area (reduced by thread)
- futa – specified tensile strength of anchor steel and shall not be greater than 1.9 fya and 860 MPa
Shear resistance of anchor according to ACI 318-19 chap. 17.7.1.2 (a)
The steel strength in shear for headed studs is determined as:
where:
ϕa,v – strength reduction factor for anchors in tension according to ACI 318-19 chap. 17.5.3 (a)
Ase,V – tensile stress area (reduced by thread)
futa – specified tensile strength of anchor steel and shall not be greater than 1.9 fya and 860 MPa
Shear resistance of anchor according to ACI 318-19 chap. 17.7.1.2 (b)
The steel strength in shear for anchors from bolt material and reinforcement is determined as:
where:
- ϕa,v – strength reduction factor for anchors in tension according to ACI 318-19 chap. 17.5.3 (a)
- Ase,V – tensile stress area (reduced by thread)
- futa – specified tensile strength of anchor steel and shall not be greater than 1.9 fya and 860 MPa
Shear resistance of anchor connected to a base with mortar - ACI 318-19 chap. 17.7.1.2.1
If anchors are used with built-up grout pads (Group 2), the design strength calculated in accordance with 17.7.1.2 shall be multiplied by 0.80.
Interaction in tension and shear according to ACI 318-19 chap. 17.8
It shall be permitted to neglect the interaction between tension and shear if (a) or (b) is satisfied.
(a) Nua/(ϕNn) ≤ 0.2
(b) Vua/(ϕVn) ≤ 0.2
If Nua/(ϕNn) > 0.2 for the governing strength in tension and Vua/(ϕVn) > 0.2 for the governing strength in shear, then Eq. (17.8.3) shall be satisfied.
Compressive resistance of anchor according to AASHTO LRFD Article 6.9.2
where:
- ϕa,c – the strength reduction factor for anchors in compression according to AASHTO LRFD article 6.5.4.2
- If , then: , Otherwise:
- Ag – gross cross-sectional area of member (in2)
- Fy – specified minimum yield stress of the type of steel being used (ksi)
- - elastic critical buckling resistance (kip)
- E – modulus of elasticity of steel (ksi)
- K = 2 – effective length factor according to Article 4.6.2.5
- l – unbraced length in plane of bucling (in)
- – radius of gyration
- – moment of inertia of the bolt
Bending resistance of anchor according to AASHTO LRFD Article 6.12.2.2.7
where:
- – plastic section modulus of the bolt
- – elastic section modulus of the bolt
Shear resistance of anchor according to AASHTO LRFD Article 6.10.9
where:
- AV = 0.844As – the shear area
- As – the bolt area reduced by threads
Concrete crushing at the anchor–concrete interface
The anchor shear resistance is also limited from the point of view of concrete crushing at the anchor–concrete interface. The limit values and the method for determining them are described in detail in the article - Shear behaviour of anchors in reinforced concrete. Once the contact force reaches this limit, the stop criterion is triggered, and the analysis is terminated before the resistance is exceeded.
Pull-out check for headed anchors (Washer plates and Headed studs)
For headed anchors, an additional stop criterion is implemented to check the concrete bearing (crushing) above the anchor head - pull-out. During the analysis, the compressive force transferred through the head-to-concrete contact is monitored and compared with the limit value given by ACI 318-19, Clause 17.6.3.2.2a (pull-out failure of headed fastenings).
where:
- is the strength reduction factor - Table 17.5.3(c)
- Abrg net bearing area of the head of stud, anchor bolt, or headed deformed bar (without the shank area).
- f'c is the specified compressive strength of concrete
- is the pullout cracking factor according to 17.6.3.3, and is always taken as 1.0, i.e. the value for cracked concrete. This is consistent with the CSFM approach used in Detail, where the tensile strength of concrete is neglected and the concrete is assumed to be cracked in tension.
Once the contact force reaches this code-based limit, the stop criterion is triggered, and the analysis is terminated before the pull-out resistance is exceeded.
Anchorage - Bond stress
The bond shear stress is evaluated independently as the ratio between the bond stress τb calculated by FE analysis and the bond strength fbu.
However, since bond strength is not explicitly defined in AASHTO, its value must be determined using the equations that define the development length. Bond strength is, in fact, the primary input for determining the development length; see, for example, this article AASHTO LRFD (2024) Article C5.10.8.2 or NCHRP Report 733, Attachment E page E-9.
The calculation described in AASHTO LRFD (2024) Article 5.10.8.2.1 and 5.10.8.2.2, which requires knowledge of the maximum center-to-center spacing of transverse reinforcement within ld, the number of bars or wires developed along the plane of splitting, the total cross-sectional area of all transverse reinforcement, and other geometric quantities that cannot be reliably determined in the Detail application model for general input, an approach was adopted from AASHTO LRFD (2014) Article 5.11.2.1.1 in the following way:
Let us assume that if we anchor the reinforcement bar into a concrete block to the development length ld or greater, pulling out the reinforcement will lead to rupture of the reinforcement and not to pulling out of the concrete. This can be written with the following formula.
where:
- db is the diameter of the reinforcement bar
- ld is the development length
- fbu is the bond strength
- fy is the yield strength of the reinforcement
- Ab is the area of the reinforcement rebar
From the preceding, the formula for calculating bond strength can be easily derived.
The basic tension development length ldb is determined in AASHTO LRFD (2014) Article 5.11.2.1.1 as follows:
For No. 11 bar and smaller:
For No. 14 bars:
For No. 18 bars:
where:
- Ab is the area of the reinforcement rebar (in2)
- fy is the specified yield strength of the reinforcement (ksi)
- f'c specified compressive strength of concrete at 28 days, unless another age is specified (ksi)
- db is the diameter of the reinforcement bar (in)
Then, by multiplying the basic development length ldb by factors described in AASHTO LRFD (2014) Article 5.11.2.1.2 and 5.11.2.1.3, the development length ld as an input is determined.
Modification factors decreasing the development length from 5.11.2.1.3 are always equal to 1.0 in the application. The modification factor for top horizontal or nearly horizontal reinforcement is equal to 1.4 for 'poor' bond conditions, according to the following figure:
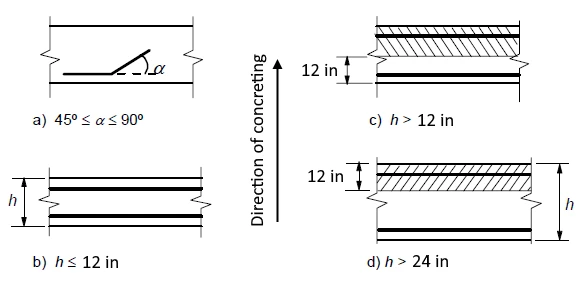
The direction of concreting can be set in the application.
All other factors determined in 5.11.2.1.2 are equal to 1.0 because only normal-weight concrete is supported, and only uncoated reinforcement is supported.
The bond shear stress and bond strength of bars in compression are calculated analogously to bars in tension, but equations from AASHTO LRFD (2014) Article 5.11.2.2 are used.
There is also an option to model smooth rebars. More information can be found here: Smooth rebars in Detail
Total force Ftot and limit force Flim
The total force Ftot is a result of the finite element analysis and can be defined in two ways.
where Ab is the area of the reinforcement bar and fs is the stress in the bar.
Or as a sum of the anchorage force Fa and the bond force Fbond.
where Fa is the actual force in the anchorage spring and Fbond is the bond force that can be obtained by integrating the bond stress τb along the length of reinforcement bar l.
Cs is the circumference of the reinforcement bar.
The limit force Flim is the maximum force in the element of the rebar considering the strength of the rebar and also anchoring conditions (bond between concrete and reinforcement and anchorage hooks, loops, etc.).
where Cs is the circumference of the reinforcement bar, and l is the length from the beginning of the rebar to the point of interest.
where Flim,add is the additional force calculated from the magnitude of the angle between neighboring elements. Flim,2 must be always lower than Fu.
The available anchorage types in CSFM include a straight bar (i.e., no anchor end reduction), 90-degree hook, 180-degree hook, perfect bond, and continuous bar. All these types, along with the respective anchorage coefficients β, are shown in Fig. 6.3.4 for longitudinal reinforcement. The values of the adopted anchorage coefficients are derived from the comparison of the equation from section AASHTO LRFD (2014) 5.11.2.1 and equations taken from section AASHTO LRFD (2014) 5.11.2.4.1. It should be noted that, in spite of the different available options, CSFM distinguishes three types of anchorage ends: (i) no reduction in the anchorage length, (ii) a reduction of 30% of the anchorage length in the case of a normalized anchorage, and (iii) perfect bond.
The anchorage coefficient for stirrups (available for beam element) is always - β = 1.0.
In order to comply with AASHTO, the anchorage spring should be used in the calculation. The anchorage spring is modified by the β coefficient, so the user must use one of the available anchorage types when defining the reinforcement start and end conditions.
7 Structural verifications according to Australian standard AS 3600
The CSFM is a structural analysis method that satisfies the general rules in Chapters 6.1.1 and 6.1.2 and is defined as (f) non-linear stress analysis in Chapter 6.1.3 - further in Chapter 6.6.
In order to satisfy the requirements in Sections 6.6.4 and 6.6.5 - more can be found in AS3600:2018 Sup 1:2022 Section C6.6 - verification and validations of the method were done. Individual articles summarizing the results of verification and validation can be found at the following link.
Since IDEA StatiCa Detail is a practical design program, factored characteristic compressive cylinder strength at 28 days f'c is used for calculations, as is described in the next chapter.
7.1 Material models in 3D CSFM (AS 3600)
Concrete - Strength
The concrete model implemented for strength calculations in CSFM is based on the parabolic-plastic stress-strain curve. The tensile strength is neglected, as it is in classic reinforced concrete design.
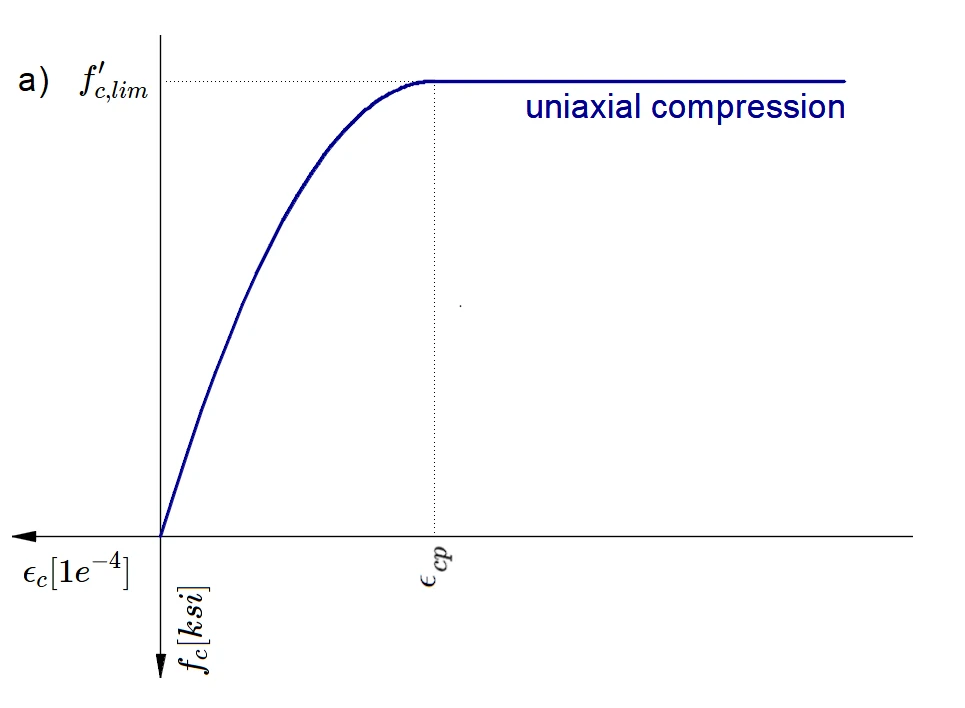
The implementation of CSFM in IDEA StatiCa Detail does not consider an explicit failure criterion in terms of strains for concrete in compression (i.e., after the peak stress is reached, it considers a plastic branch with εcp in maximum value 5%, while AS 3600 Cl. 8.3.1 assumes ultimate strain of less than 0.3%). This simplification does not allow the deformation capacity of structures failing in compression to be verified. However, the strength is properly predicted when the increase in the brittleness of concrete as its strength rises is considered by means of the reduction factor defined in fib Model Code 2010 as follows:
where:
α2 is the reduction factor of concrete compressive strength defined in AS 3600 Cl. 8.3.1
When using a parabola-rectangle stress-strain diagram, it is necessary to reduce the maximum compressive stress by this factor. This averages the stress distribution in the compression zone in such a way that the resulting compressive strength is less than or equal to the compressive strength calculated using a stress-strain diagram with a decreasing plastic branch. An analogous approach is defined for the Rectangular stress block in Chapter 8.1.3.
Φs is the stress reduction factor for concrete. The default value is set according to AS 3600 Table 2.2.3.
f'c is the concrete cylinder strength (in MPa for the definition of ).
Reinforcement
A perfectly elasto-plastic stress-strain diagram with a defined yield point for the non-prestresses reinforcement is considered, see AS 3600 Section 3.2. The definition of this diagram only requires the basic properties of the reinforcement to be known – the strength and modulus of elasticity.
The reinforcement stress-strain diagram can be also defined by the user, but in this case, it is impossible to assume the tension stiffening effect (it is impossible to calculate crack width).
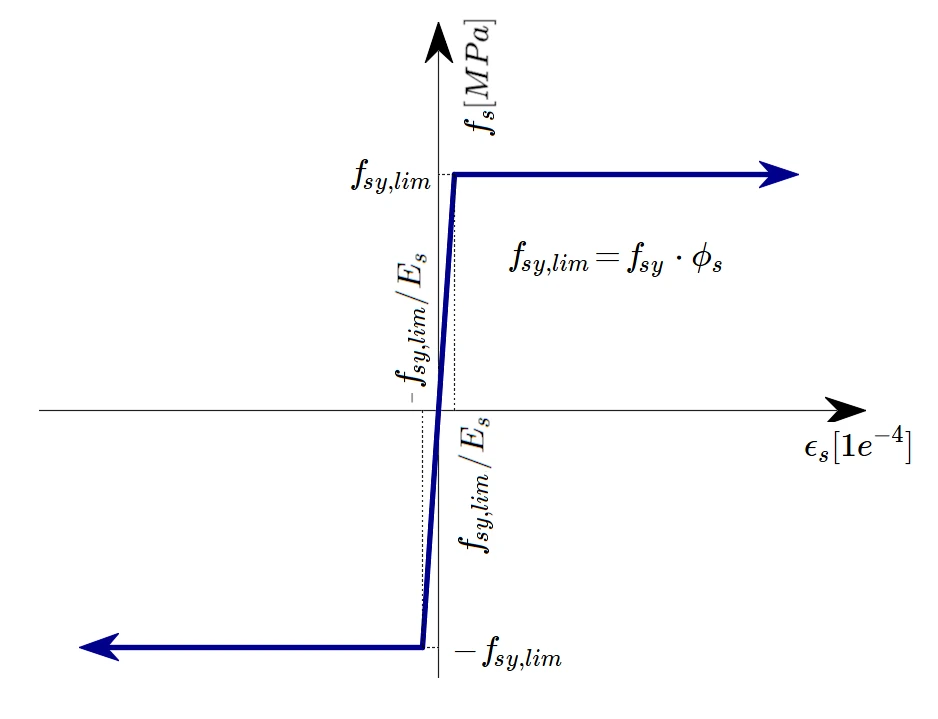
where:
Φs is the strength reduction factor for reinforcement. Where the default value is set according to AS 3600 Table 2.2.3.
fy is the yield strength of reinforcement
Es modulus of elasticity of reinforcement
Tension stiffening (Fig. 7.1.3) is accounted for automatically by modifying the input stress-strain relationship of the bare reinforcing bar in order to capture the average stiffness of the bars embedded in the concrete (εm).
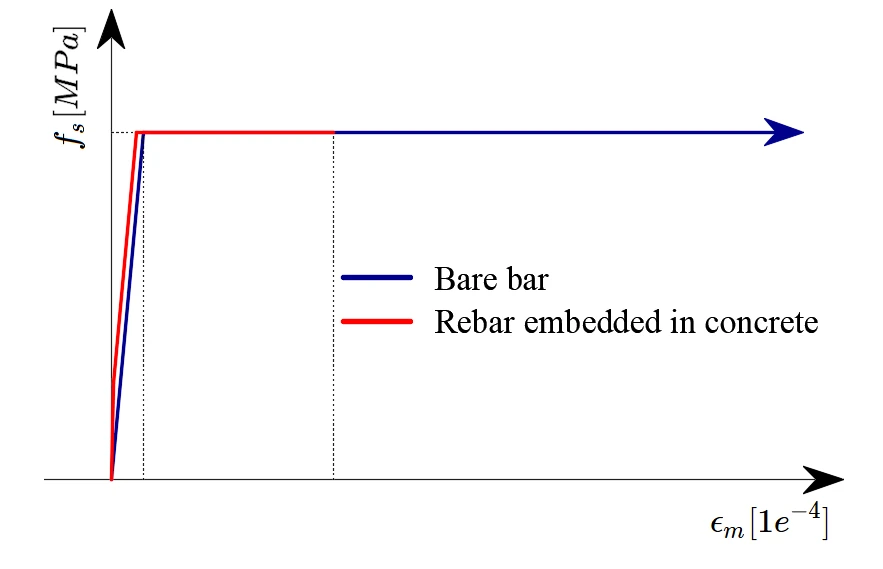
7.2 Stress and strength reduction factors and load factors
The Compatible Stress Field Method is compliant with modern design codes. As the calculation models only use standard material properties, the partial safety factor format prescribed in the design codes can be applied without any adaptation. In this way, the input loads are factored, and the characteristic material properties are reduced using the respective stress reduction factors, exactly as in conventional concrete analysis.
Values of stress reduction factors are prescribed in AUS 3600 Cl. 2.2.3 and other sections depicted in the following figure.
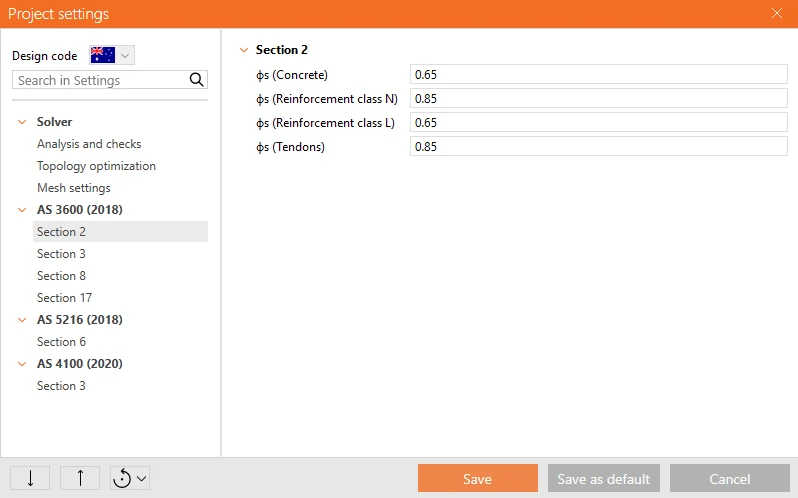
Load factors for Strength combinations shall be defined according to AS 3600 Cl. 4.2.2. Load factors for Serviceability combinations shall be determined according to Table 4.1. For all templates, load factors are already predefined.
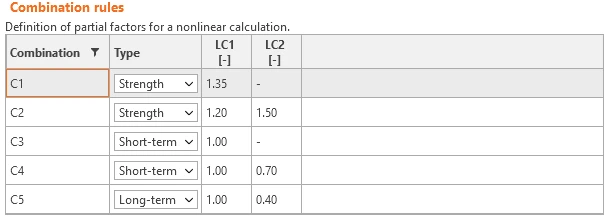
7.3 Strength and anchorage verifications in Detail 3D
The different verifications required by AS 3600 are assessed based on the direct results provided by the model. Verifications are carried out for concrete strength, reinforcement strength, and anchorage (bond shear stresses).
Strength - Concrete
The concrete strength in compression is evaluated as the ratio between the maximum Equivalent principal stress fc,eq (also σc,eq in previous text) obtained from FE analysis and the limit value f'c,lim.
Equivalent Principal Stress expresses the equivalent uni-axial stress for a general tri-axial stress state.
The fc,eq value can, therefore, be directly compared with uniaxial strength limits. This expression is derived from the implementation of the Mohr-Coulomb plasticity theory, conservatively assuming the angle of internal friction φ = 0°.
Strength - Reinforcement
The strength of the reinforcement is evaluated in both tension and compression as the ratio between the stress in the reinforcement at the cracks fs and the specified limit value fsy,lim.
Strength - Anchors
Anchors are checked for normal stresses in a similar way to reinforcement, where the limit value fsy,lim is determined.
To make it easier to navigate the following text, we will first divide anchoring into three groups in terms of code-checking according to AS 5216 and AS 4100.
Group 1
- Anchorage Types
- Cast-in plate
- Base plate - Stand-off = direct
- Base plate - Stand-off = Mortar joint - thickness of mortar less than 0.5 times the anchor diameter
- Single anchor with projected length less than 0.5 times anchor diameter
- Anchor code-checks
- Tension/compression
- All materials in tension – AS 5216 chap. 6.2.2
- All anchor types in compression – AS 4100 chap. 6.3.3
- Shear without lever arm
- All materials – AS 5216 chap. 7.2.2.2
- Interaction of tension and shear - AS 5216 chap. 8.1.1
Group 2
- Anchorage Types
- Base plate - Stand-off = Mortar joint - thickness of mortar more than 0.5 times the anchor diameter
- Anchor code-checks
- Tension/compression
- All materials in tension – AS 5216 chap. 6.2.2
- All anchor types in compression – AS 4100 chap. 6.3.3
- Shear with lever arm
- All materials – AS 5216 chap. 7.2.2.3
Interaction verification according to AS 5216 shall not be required for post-installed fasteners or anchor channel bolts subjected to shear load that has a lever arm since this interaction is accounted for in Equation 7.2.2.3(2).
Group 3
- Anchorage types
- Base plate - Stand-off = gap
- Single anchor with projected length more than 0.5 times the anchor diameter
- Anchor code-checks (ACI / AISC)
- Tension/compression (with buckling)
- All materials in tension – AS 5216 chap. 6.2.2 or AS 4100 chap. 9.2.2.2 (can be selected in settings)
- All anchor types in compression – AS 4100 chap. 6.3.3
- Bending
- For all anchor types – AS 4100 chap. 5.1
- Shear
- For all anchor types – AS 4100 chap. 5.11
- Interaction described further
Tensile resistance of anchor according to AS 5216 chap. 6.2.2
where:
- ϕNtf – design resistance of anchor in tension
- – strength reduction factor for anchors in tension according to AS 5216 Table 3.2.4
- As – tensile stress area (reduced by thread)
- fuf – specified tensile strength of anchor steel
Shear resistance of anchor according to AS 5216 chap. 7.2.2.2
The steel strength in shear without lever arm is determined as:
where:
- ϕVtf – design resistance of anchor in shear
- As – tensile stress area (reduced by thread)
- fuf – specified tensile strength of anchor steel
The design resistance of a single fastener in case of steel failure, or fasteners with a ratio hef / dnom < 5 and a concrete compressive strength class < 20 MPa, the design resistance ϕVtf should be multiplied by a factor of 0.8.
Shear resistance of anchor according to AS 5216 chap. 7.2.2.3
The steel strength in shear with lever arm is determined as:
where:
- αM = 2 – parameter accounting for the degree of restraint, fixture is assumed to be prevented from rotating – Cl. 4.2.2.4
- – characteristic flexural strength of the fastener influenced by the axial load
- – length of the lever arm
- – distance between the assumed point of restraint of the fastener loaded in shear and the surface of the concrete
- – eccentricity of the applied shear load relative to the concrete surface, neglecting the thickness of a levelling grout or mortar
- tg – thickness of grout layer
- tfix – thickness of base plate
- d – nominal diameter of the fastener
- N* – design tension load
- ϕMs NRk,s – tensile strength of a fastener to steel failure
- – characteristic flexural strength of the fastener – ETAG 001 – Annex C
- – elastic section modulus of the fastener, the diameter reduced by threads
- – is used instead of nominal diameter d for threaded rods and washer plates
Interaction in tension and shear according to AS 5216 chap. 8.1.1
Where:
- N* – design tension force applied to a single fastener
- V* – design shear force applied to a single fastener
- ϕNRk,s – design tensile strength of a single fastener
- ϕVRk,s – design shear strength of a single fastener
Tensile resistance of anchor according to AS 4100 chap. 9.2.2.2
where:
- As – tensile stress area (reduced by thread) as specified in AS 1275
- ϕa,t – capacity factor for bolts according to AS 4100 Table 3.4
Compressive resistance of anchor according to AS 4100 chap. 6.3.3
where:
- ϕa,c – capacity factor for bolts according to AS 4100 Table 3.4
- – nominal member capacity – Cl. 6.3.3
- – nominal section capacity – Cl. 6.2
- fy – anchor yield strength
- – effective length – Cl. 6.3.2
- ke = 2 – member effective length factor, it is assumed conservatively that the anchor is fixed and the bottom and pinned at the top as a sway member
- – assumed length of the member
- lgap – gap height
- d – nominal bolt diameter
- tp – base plate thickness
- – member slenderness reduction factor
- αb = 0.5 – compression member section constant - Table 6.3.3
- kf = 1 – form factor – Cl. 6.2.2
- – radius of gyration
- – moment of inertia
- As – tensile stress area of a bolt as defined in AS 1275
- – diameter reduced by threads
Bending resistance of anchor according to AS 4100 chap. 5.1
where:
- ϕa,b – capacity factor for bolts according to AS 4100 Table 3.4
- fy – anchor yield strength
- – effective section modulus – Cl. 5.2.3
- – plastic section modulus; if a thread exists, nominal diameter d is replaced by diameter reduced by threads, ds
- – elastic section modulus; if a thread exists, nominal diameter d is replaced by diameter reduced by threads, ds
Shear resistance of anchor according to AS 4100 chap. 5.11
where:
- ϕ – capacity factor for bolts according to AS 4100 Table 3.4
- fy – anchor yield strength
- Aw = 0.844 As – shear area
- As – tensile stress area (reduced by thread)
Interaction in tension and bending
where:
- N*tf – design tensile force
- ϕNt – design tensile resistance of anchor
- M* – design bending moment due to shear on a lever arm
- ϕMs – design bending resistance of anchor
Interaction in compression and bending
where:
- N* – design compressive force
- ϕNc – design compressive resistance of anchor
- M* – design bending moment due to shear on a lever arm
- ϕMs – design bending resistance of anchor
Concrete crushing at the anchor–concrete interface
The anchor shear resistance is also limited from the point of view of concrete crushing at the anchor–concrete interface. The limit values and the method for determining them are described in detail in the article - Shear behaviour of anchors in reinforced concrete. Once the contact force reaches this limit, the stop criterion is triggered, and the analysis is terminated before the resistance is exceeded.
Pull-out check for headed anchors (Washer plates and Headed studs)
For headed anchors, an additional stop criterion is implemented to check the concrete bearing (crushing) above the anchor head - pull-out. During the analysis, the compressive force transferred through the head-to-concrete contact is monitored and compared with the limit value given by AS 5216:2021 Cl. 6.3.4 (pull-out failure of headed fastenings).
where:
- is the strength reduction factor - Table 3.2.4
- Ah is the load bearing area of the head of the fastener (without the shank area).
- f'c is the specified compressive strength of concrete
- k2 is always taken as 7.5, i.e. the value for cracked concrete. This is consistent with the CSFM approach used in Detail, where the tensile strength of concrete is neglected and the concrete is assumed to be cracked in tension.
Once the contact force reaches this code-based limit, the stop criterion is triggered and the analysis is terminated before the design pull-out resistance is exceeded.
Anchorage - Bond stress
The bond shear stress is evaluated independently as the ratio between the bond stress τb calculated by FE analysis and the design ultimate bond stress fbu.
For the determination of the design ultimate bond stress fbu, the formula C13.1.2.2 defined in AS3600:2018 Sup 1:2022 is considered in the application.
Where f'c ≤ 65 MPa (in the formula is in MPa), and k factors are determined from AS 3600 Cl. 13.1.2.2 as follows:
k3 = 0.7 (conservative value for all reinforcement)
k2 = (132 - db) / 100 (db is diameret of rebar in millimeters)
= 1.3 for a horizontal bar with more than 300 mm of concrete cast below the bar, or 1.0 otherwise
k1 is automatically derived from the position of the reinforcement in the model and from the direction of concreting that can be set in the application for each project item as follows.
The basic development length Lsy,tb is calculated according to formula 13.1.2.2 in AS 3600 as follows:
As can be seen in the formula, the basic development length Lsy,tb is limited from below, and therefore the design ultimate bond stress fbu must be limited in the same way in the application, so the following applies:
Where fsy is in MPa.
The derivation of the fbu limitation is as follows:
Total force Ftot and limit force Flim
The total force Ftot is a result of the finite element analysis and can be defined in two ways.
where As is the area of the reinforcement bar and fs is the stress in the bar.
Or as a sum of the anchorage force Fa and the bond force Fbond.
where Fa is the actual force in the anchorage spring and Fbond is the bond force that can be obtained by integrating the bond stress τb along the length of reinforcement bar l.
Cs is the circumference of the reinforcement bar.
The limit force Flim is the maximum force in the element of the rebar considering the strength of the rebar and also anchoring conditions (bond between concrete and reinforcement and anchorage hooks, loops, etc.).
where Cs is the circumference of the reinforcement bar, and l is the length from the beginning of the rebar to the point of interest.
where Flim,add is the additional force calculated from the magnitude of the angle between neighboring elements. Flim,2 must always be lower than Fu.
The available anchorage types in CSFM include a straight bar (i.e., no anchor end reduction), Standard cog, Standard hook, perfect bond, and continuous bar. All these types, along with the respective anchorage coefficients β, are shown in Fig. 7.3.3 for longitudinal reinforcement. The values of the adopted anchorage coefficients are derived from AS 3600 Cl. 13.1.2. It should be noted that CSFM distinguishes three types of anchorage ends: (i) no reduction in the anchorage length, (ii) a reduction of 50% of the anchorage length in the case of a normalized anchorage, and (iii) perfect bond.

The anchorage coefficient for stirrups is always - β = 1.0.
In order to comply with AS 3600, the anchorage spring should be used in the calculation. The anchorage spring is modified by the β coefficient, so the user must use one of the available anchorage types when defining the reinforcement start and end conditions.
8 Structural verifications according to CSA A23.3:24
The CSFM is a structural analysis method that satisfies the requirements for finite element analysis given in CSA A23.3:24 Clause 9.5. The effects of cracking are accounted for directly in the material models (Clause 9.5.1), the anchorage of the reinforcement is explicitly considered (Clause 9.5.3). As the CSFM is a continuous stress field method, it is also consistent with the analysis by strut-and-tie models permitted by Clause 9.4, and the limit on the compressive stress in struts given in Clause 11.4.2.3 is reflected in the limit compressive strength of concrete (see the definition of the factors α and kc2 below).
Verification and validation of the method were performed at various universities. Individual articles summarizing the results of verification and validation can be found at the following link.
Since IDEA StatiCa Detail is a practical design program, the factored specified compressive strength of concrete f'c is used for calculations, as is described in the next chapter.
8.1 Material models in 3D CSFM (CSA)
Concrete - Strength
The concrete model implemented for strength calculations in CSFM is based on the parabolic-plastic stress-strain curve. The tensile strength is neglected, as it is in classic reinforced concrete design. Only the parabola-rectangle diagram for concrete is supported for the CSA design code.
The implementation of CSFM in IDEA StatiCa Detail does not consider an explicit failure criterion in terms of strains for concrete in compression (i.e., after the peak stress is reached, it considers a plastic branch with εc in maximum value 5%, while CSA A23.3:24 Clause 10.1.3 assumes a maximum concrete compressive strain of 0.0035). This simplification does not allow the deformation capacity of structures failing in compression to be verified. However, the strength is properly predicted when the increase in the brittleness of concrete as its strength rises is considered by means of the ηfc reduction factor defined in fib Model Code 2010 as follows:
where:
α is the factor accounting for differences between the in-place strength and the strength of the standard cylinder according to CSA A23.3:24 Clause 10.1.6. The Note to that clause requires that stress blocks be based on stress-strain curves with a peak stress not greater than 0.9 f'c. The factor is also aligned with the requirement to limit the compressive stress in struts according to Clause 11.4.2.3. The default value is set to 0.85 and can be modified in the Project settings.
Note: α is a single user-defined value applied to the parabola-rectangle stress-strain diagram. It should not be confused with the factor α1 of the equivalent rectangular concrete stress distribution, which CSA A23.3:24 Clause 10.1.7 defines as strength-dependent (α1 = 0.85 − 0.0015 f'c ≥ 0.67, Equation 10.1).
Φc is the resistance factor for concrete according to CSA A23.3:24 Clause 8.4.2.
f'c is the specified compressive strength of concrete (in MPa for the definition of ηfc)
Reinforcement
A perfectly elasto-plastic stress-strain diagram with a defined yield point for the non-prestressed reinforcement is considered. The reinforcement materials are defined by CSA G30.18:21. The definition of this diagram only requires the basic properties of the reinforcement to be known – the strength and modulus of elasticity.
The reinforcement stress-strain diagram can also be defined by the user, but in this case, it is impossible to assume the tension stiffening effect (it is impossible to calculate crack width).
where:
Φs is the resistance factor for reinforcement according to CSA A23.3:24 Clause 8.4.3.
fsy is the yield strength of reinforcement
Es modulus of elasticity of reinforcement
10% is selected as the limit strain at which the calculation is stopped. This is considered safe based on ASTM A955/A955M-20c Article 7.
Tension stiffening (Fig. 8.1.3) is accounted for automatically by modifying the input stress-strain relationship of the bare reinforcing bar to capture the average stiffness of bars embedded in concrete (εm).
8.2 Resistance and load factors
The Compatible Stress Field Method is compliant with modern design codes. As the calculation models only use standard material properties, the partial safety factor format prescribed in the design codes can be applied without any adaptation. In this way, the input loads are factored, and the specified material properties are reduced using the respective resistance factors, exactly as in conventional concrete analysis.
Values of material resistance factors for concrete and reinforcement are prescribed in CSA A23.3:24 Clause 8.4. Because the 3D model includes the code-check of anchors, the resistance factors of CSA A23.3:24 Annex D and of CSA S16:24 are required in addition.
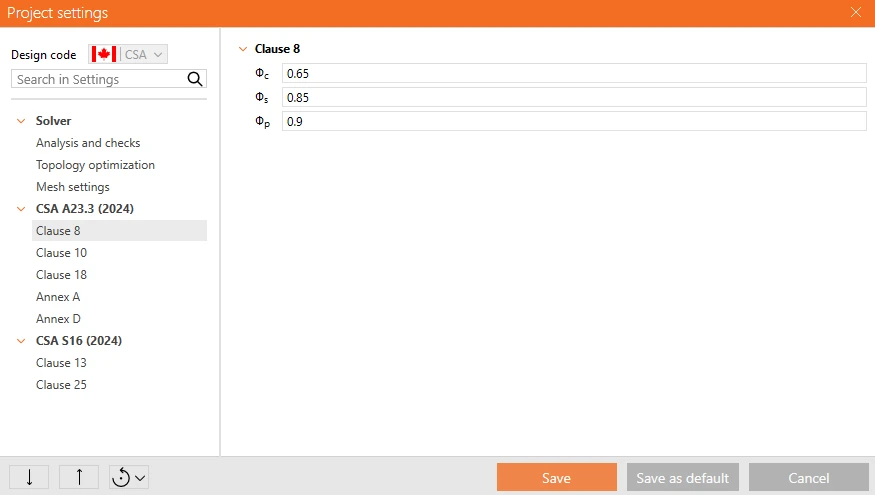
The resistance modification factors for anchors are prescribed in CSA A23.3:24 Clause D.5.3.
The steel resistance of anchors with a stand-off is determined according to CSA S16:24, which requires the resistance factor for anchor rods of Clause 13.1 i) and the parameter for compressive resistance of Clause 13.3.1.1.
The coefficients accounting for the anchor rod diameter and for the calibration of the shear stress are prescribed in Clause 25.4.3. The diameter coefficient kd enters the tensile stress area An = 0.75 kd Aar of Clause 25.4.3.1.1 and the shear stress area of Clause 25.4.3.2:
Load factors and load combinations shall be determined in accordance with the applicable building code, as required by CSA A23.3:24 Clause 8.2.1 and Clause 8.3.1. CSA A23.3:24 itself specifies requirements in accordance with the National Building Code of Canada (Clause 1.1), and an adapted version of its load combination provisions is reproduced in CSA A23.3:24 Annex C (informative). .
It is the responsibility of the user to define the load combinations relevant to the structure being assessed and to the code edition enforced by the relevant authority.
3D models provide results for Strength checks only, so only ULS combinations are evaluated.
8.3 Ultimate limit state in Detail 3D
The different verifications required by CSA A23.3:24 are assessed based on the direct results provided by the model. Verifications are carried out for concrete strength, reinforcement strength, anchors, and anchorage (bond shear stresses).
Strength - Concrete
The concrete strength in compression is evaluated as the ratio between the maximum Equivalent principal stress fc,eq (also σc,eq in previous text) obtained from FE analysis and the limit value f'c,lim.
Equivalent Principal Stress expresses the equivalent uni-axial stress for a general tri-axial stress state.
The fc,eq value can, therefore, be directly compared with uniaxial strength limits. This expression is derived from the implementation of the Mohr-Coulomb plasticity theory, conservatively assuming the angle of internal friction φ = 0°.
Strength - Reinforcement
The strength of the reinforcement is evaluated in both tension and compression as the ratio between the stress in the reinforcement at the cracks fs and the specified limit value fsy,lim.
Strength - Anchors
Anchors are checked for normal stresses in a similar way to reinforcement, where the limit value fy,lim is determined.
Providing complete code-checks for anchors according to the Canadian code requires the provisions of both CSA A23.3:24 Annex D and CSA S16:24. This allocation follows CSA S16:24 Clause 25.1, according to which the steel resistance of cast-in anchor rods is determined in accordance with Clause 25.4.3 of that Standard, and the concrete resistance in accordance with CSA A23.3, Annex D.
The governing failure mechanism depends on the geometry of the system consisting of a base plate and anchors. To make it easier to navigate the following text, anchoring is first divided into three groups in terms of code-checking.
Group 1
- Anchorage Types
- Cast-in plate
- Base plate - Stand-off = direct
- Base plate - Stand-off = Mortar joint - thickness of mortar less than 0.5 times the anchor diameter
- Single anchor with projected length less than 0.5 times anchor diameter
- Anchor code-checks
- Tension/compression
- All anchor types in tension – CSA A23.3:24 Clause D.6.1.2
- All anchor types in compression – CSA S16:24 Clause 13.3.1.1
- Shear without lever arm
- Headed studs – CSA A23.3:24 Clause D.7.1.2 a)
- Anchors made of bolt material and reinforcement: CSA A23.3:24 Clause D.7.1.2 b)
- Interaction of tension and shear - CSA A23.3:24 Table D.1
Group 2
- Anchorage Types
- Base plate - Stand-off = Mortar joint - thickness of mortar more than 0.5 times the anchor diameter
Anchor code-checks are the same as for Group 1, except that the shear resistance is determined with a lever arm according to CSA A23.3:24 Clause D.7.1.3, which introduces the reduction factor for anchors used with built-up grout pads.
Group 3
- Anchorage types
- Base plate - Stand-off = gap
- Single anchor with projected length more than 0.5 times the anchor diameter
For this group the anchor acts as a short steel member and the code-check is therefore carried out entirely according to CSA S16:24:
- Anchor code-checks
- Tension/compression (with buckling)
- All anchor types in tension – CSA S16:24 Clause 25.4.3.1.1
- All anchor types in compression – CSA S16:24 Clause 25.4.3.1.2 with Clause 13.3.1.1
- Bending
- For all anchor types – CSA S16:24 Clause 25.4.3.3
- Shear
- For all anchor types – CSA S16:24 Clause 25.4.3.2
Tensile resistance of anchor – CSA A23.3:24 Clause D.6.1.2 (Group 1 and Group 2)
where:
- ϕs – the resistance factor for reinforcement and embedded steel anchors according to Clause 8.4.3
- RN – the resistance modification factor for the anchor subjected to tension loads according to Clause D.5.3
- Ase,N – the effective cross-sectional area of the anchor in tension
- futa – the tensile strength of the anchor steel, which shall not be taken greater than 1.9 fya and 860 MPa
Shear resistance of anchor – CSA A23.3:24 Clause D.7.1.2 (Group 1)
For headed studs without a lever arm, according to Clause D.7.1.2 a):
For anchors made of bolt material and for reinforcement without a lever arm, according to Clause D.7.1.2 b):
where:
- RV – the resistance modification factor for the anchor subjected to shear loads according to Clause D.5.3
- Ase,V – the effective cross-sectional area of the anchor in shear
Shear resistance of anchor – CSA A23.3:24 Clause D.7.1.2 with D.7.1.3 (Group 2)
Where the anchor is used with a built-up grout pad, the shear resistance determined above is reduced by the factor g according to Clause D.7.1.3. For headed studs:
and for anchors made of bolt material and for reinforcement:
where g = 0.8 is the reduction factor for the anchor used with built-up grout pads according to Clause D.7.1.3.
Interaction of tension and shear in steel – CSA A23.3:24 Table D.1 (Group 1 and Group 2)
where:
- Nfa – the factored tensile force and Nsar the factored resistance of the anchor in tension
- Vfa – the factored shear force and Vsar the factored resistance of the anchor in shear
Tensile resistance of the anchor – CSA S16:24 Clause 25.4.3.1.1 (Group 3)
where:
- Φar – the resistance factor for anchor rods according to Clause 13.1
- An – the tensile stress area of the anchor
- kd – the anchor rod diameter coefficient
- Aar – the cross-sectional area of an anchor rod based on its nominal diameter d
- Fu is the tensile strength of the anchor steel
Compressive resistance of anchor – CSA S16:24 Clause 13.3.1.1 (all groups)
where:
- As – the area of the anchor reduced by threads, if these exist
- Fy – the yield strength of the anchor steel
- Fe – the elastic buckling stress according to Clause 13.3.1.2
- E – the modulus of elasticity of the anchor steel
- KL = 2 L – the buckling length. It is assumed on the safe side that the anchor is fixed in the concrete and able to rotate freely at the base plate
- L – the laterally unbraced length of the member, taken as the summation of half of the base plate thickness, the gap, and half of the anchor diameter
- r = √(Is/As) – the radius of gyration of the anchor and Is = π ds4 / 64 its moment of inertia, where ds is the anchor diameter reduced by threads, if these exist
- n – the parameter for compressive resistance according to Clause 13.3.1.1
Bending resistance of anchor – CSA S16:24 Clause 25.4.3.3 (Group 3)
For anchors as headed studs and for reinforcement welded to the base plate, i.e. where the critical section for bending is not in the threaded region:
For anchors made of bolt material and for headed studs and reinforcement with a cut thread:
where Zar = d3 / 6 is the plastic section modulus of the anchor based on its nominal diameter d.
Shear resistance of anchor – CSA S16:24 Clause 25.4.3.2 (Group 3)
For anchors as headed studs and for reinforcement welded to the base plate:
For anchors made of bolt material and for headed studs and reinforcement with a cut thread:
where:
- Av = 0.70 · kd · Aar is the shear stress area of the anchor
- kn is the shear stress calibration coefficient according to Clause 25.4.3.2
Interaction of axial force and bending (Group 3)
For an anchor in tension:
For an anchor in compression:
where Mfa is the factored bending moment due to the shear force acting on the lever arm and Msar is the factored bending resistance of the anchor.
CSA S16:24 Clause 25.4.3.4 and Clause 25.4.3.5 give a three-term interaction of shear, axial force, and bending. The application evaluates the shear resistance as a separate check and the interaction of axial force and bending as given above.
Concrete crushing at the anchor–concrete interface
The anchor shear resistance is also limited from the point of view of concrete crushing at the anchor–concrete interface. The limit values and the method for determining them are described in detail in the article - Shear behaviour of anchors in reinforced concrete. Once the contact force reaches this limit, the stop criterion is triggered, and the analysis is terminated before the resistance is exceeded.
Pull-out check for headed anchors (Washer plates and Headed studs)
For headed anchors, an additional stop criterion is implemented to check the concrete bearing (crushing) above the anchor head – pull-out. During the analysis, the compressive force transferred through the head-to-concrete contact is monitored and compared with the limit value given by CSA A23.3:24 Clause D.6.3.4, Equation D.17 for the pull-out resistance of a single cast-in headed anchor:
where:
- Φc is the resistance factor for concrete according to Clause 8.4.2
- RN is the resistance modification factor for the anchor subjected to tension loads according to Clause D.5.3
- Abrg is the bearing area of the head of the anchor, i.e. the net area excluding the shank area
- Clause D.6.3.3 permits the pullout resistance of single cast-in headed anchors to be calculated by Clause D.6.3.4; for single J-bolts or L-bolts Clause D.6.3.5 applies instead
- f'c is the specified compressive strength of concrete
Once the contact force reaches this code-based limit, the stop criterion is triggered, and the analysis is terminated before the pull-out resistance is exceeded.
Anchorage - Bond stress
The bond shear stress is evaluated independently as the ratio between the bond stress τb calculated by FE analysis and the design bond strength fbu.
CSA A23.3:24 does not define a bond strength explicitly. It is, however, the quantity from which the development length provisions of Clause 12 are derived, so it can be recovered from them. The derivation proceeds in few steps.
The development length ld is, by definition, the embedment length over which bond alone transfers the full yield force of the bar into the concrete. If a bar is embedded to ld or more, pulling it out causes the bar to yield rather than the bond to fail. Equating the force transferred by a uniform bond stress fbu acting on the bar circumference with the yield force of the bar cross-section:
where:
- db is the nominal bar diameter, and π db ld the bonded surface area;
- Ab = π db2 / 4 is the bar cross-sectional area;
- fyg is the specified yield strength of the reinforcement.
We can write:
The simplified equations for the tension development length of deformed bars are given in CSA A23.3:24 Table 12.1 (Clause 12.2.3). The application adopts the second, more conservative case labeled Other cases.
In the application, the modification factors defined in CSA A23.3:24 Table 12.2 (Clause 12.2.4) kc = 1.0, because only uncoated reinforcement is supported, and ka = 1.0, because only normal-density concrete is supported. The adopted expression is therefore
Substituting this expression into the equilibrium condition eliminates the development length:
Both fyg and db appear in the numerator and in the denominator and therefore cancel:
Evaluating the constant, 1 / 2.4 = 0.4167, rounded to 0.42, gives the design bond strength implemented in the application:
The modification factors are determined from CSA A23.3:24 Table 12.2 (Clause 12.2.4):
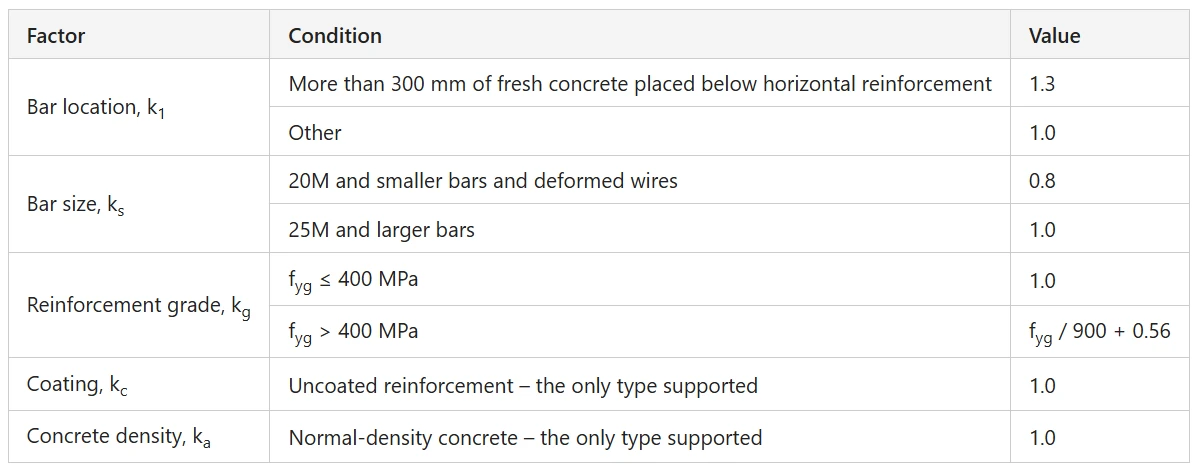
In accordance with CSA A23.3:24 Clause 12.1.2, the maximum permissible value of √f'c used in the calculation of development lengths is 8 MPa.
The factor k1 is automatically derived from the position of the reinforcement in the model according to the following figure:
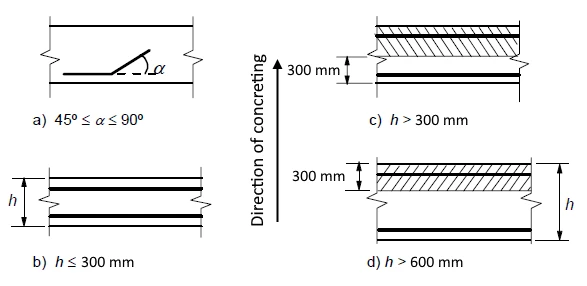
For poor bond conditions k1=1.3
The direction of concreting can be set in the application.
The bond shear stress and bond strength of bars in compression are calculated analogously to bars in tension, but the equations for the compression development length from CSA A23.3:24 Clause 12.3.2 are used.
There is also an option to model smooth rebars. More information can be found here: Smooth rebars in Detail
Total force Ftot and limit force Flim
The total force Ftot is a result of the finite element analysis and can be defined in two ways.
where As is the area of the reinforcement bar and fs is the stress in the bar.
Or as a sum of the anchorage force Fa and the bond force Fbond.
where Fa is the actual force in the anchorage spring and Fbond is the bond force that can be obtained by integrating the bond stress τb along the length of reinforcement bar l.
Cs is the circumference of the reinforcement bar.
The limit force Flim is the maximum force in the element of the rebar considering the strength of the rebar and also anchoring conditions (bond between concrete and reinforcement and anchorage hooks, loops, etc.).
where Cs is the circumference of the reinforcement bar, and l is the length from the beginning of the rebar to the point of interest.
where Flim,add is the additional force calculated from the magnitude of the angle between neighboring elements. Flim,2 must be always lower than Fu.
The available anchorage types for longitudinal and transverse reinforcement follow the hooks and bends defined in CSA A23.1:19 Clause 6.6.2. A standard hook is defined in Clause 6.6.2.2 as either a semicircular (180-degree) bend or a 90-degree bend with the prescribed extension at the free end of the bar; for stirrup and tie anchorage, either a 90-degree or a 135-degree bend is defined. The anchorage types available in CSFM for longitudinal reinforcement include a straight bar (i.e., no anchor end reduction), 90-degree bend, 180-degree bend, perfect bond, and continuous bar. All these types, along with the respective anchorage coefficients β, are shown in Fig. 8.3.5.
It should be noted that, in spite of the different available options, CSFM distinguishes three types of anchorage ends: (i) no reduction in the anchorage length, (ii) a reduction of 30% of the anchorage length in the case of a normalized anchorage, and (iii) perfect bond. The adopted anchorage coefficients are as follows:
The anchorage coefficient for stirrups (available for beam element) is always - β = 1.0.
In order to comply with CSA A23.3, the anchorage spring should be used in the calculation. The anchorage spring is modified by the β coefficient, so the user must use one of the available anchorage types when defining the reinforcement start and end conditions.
Take the latest version of IDEA StatiCa for a test drive today
Get 14 days of full access, completely free.
Check out IDEA StatiCa for freeVerifications and validations
References
- Wu, D.; Wang, Y.; Qiu, Y.; Zhang, J.; Wan, Y.-K. Determination of Mohr–Coulomb Parameters from Nonlinear Strength Criteria for 3D Slopes. Math. Probl. Eng. 2019, 6927654.
- Lelovic, S.; Vasovic, D.; Stojic, D. Determination of the Mohr-Coulomb Material Parameters for Concrete under Indirect Tensile Test. Tech. Gaz. 2019, 26, 412–419.
- Galic, M.; Marovic, P.; Nikolic, Ž. Modified Mohr-Coulomb—Rankine material model for concrete. Eng. Comput. 2011, 28, 853–887.
- Fan, Q.; Gu, S.C.; Wang, B.N.; Huang, R.B. Two Parameter Parabolic Mohr Strength Criterion Applied to Analyze The Results of the Brazilian Test. Appl. Mech. Mater. 2014, 624, 630–634.
- Janković, N., Ljubinković, F., Conde, J., Costa, J., Simões da Silva, L. (2025). Behaviour and design resistance of long bolts in tension. Journal of Constructional Steel Research, 229, 109492. https://doi.org/10.1016/j.jcsr.2025.109492 (open access, CC BY 4.0)